Basic Flowchart Symbols and Meaning
Flowcharts are the best for visually representation the business processes and the flow of a custom-order process through various departments within an organization. ConceptDraw PRO diagramming and vector drawing software extended with Flowcharts solution offers the full set of predesigned basic flowchart symbols which are gathered at two libraries: Flowchart and Flowcharts Rapid Draw. Among them are: process, terminator, decision, data, document, display, manual loop, and many other specific symbols. The meaning for each symbol offered by ConceptDraw gives the presentation about their proposed use in professional Flowcharts for business and technical processes, software algorithms, well-developed structures of web sites, Workflow diagrams, Process flow diagram and correlation in developing on-line instructional projects or business process system. Use of ready flow chart symbols in diagrams is incredibly useful - you need simply drag desired from the libraries to your document and arrange them in required order. There are a few serious alternatives to Visio for Mac, one of them is ConceptDraw PRO. It is one of the main contender with the most similar features and capabilities.
Relative Value Chart Software
Relative value is a value measured in the terms of liquidity, risks, return of one investment or financial instrument relative to another. Relative values are widely used in:business, economics, investment, management, marketing, statistics, etc. ConceptDraw PRO software is the best for drawing professional looking Relative Value Charts. ConceptDraw PRO provides Divided Bar Diagrams solution from the Graphs and Charts Area of ConceptDraw Solution Park.Venn Diagram
Venn diagrams are illustrations used in the branch of mathematics known as set theory. They show the mathematical or logical relationship between different groups of things (sets). A Venn diagram shows all the possible logical relations between the sets.Histogram
ConceptDraw PRO diagramming and vector drawing software offers the Histograms solution from the Graphs and Charts area of ConceptDraw Solution Park with powerful tools to help you draw a Histogram of any complexity quick and easy.Competitor Analysis
Competitor analysis is a first and obligatory step in elaboration the proper corporate marketing strategy and creating sustainable competitive advantage. Use powerful opportunities of numerous solutions from ConceptDraw Solution Park for designing illustrative diagrams, charts, matrices which are necessary for effective competitor analysis.Restaurant Floor Plan Software
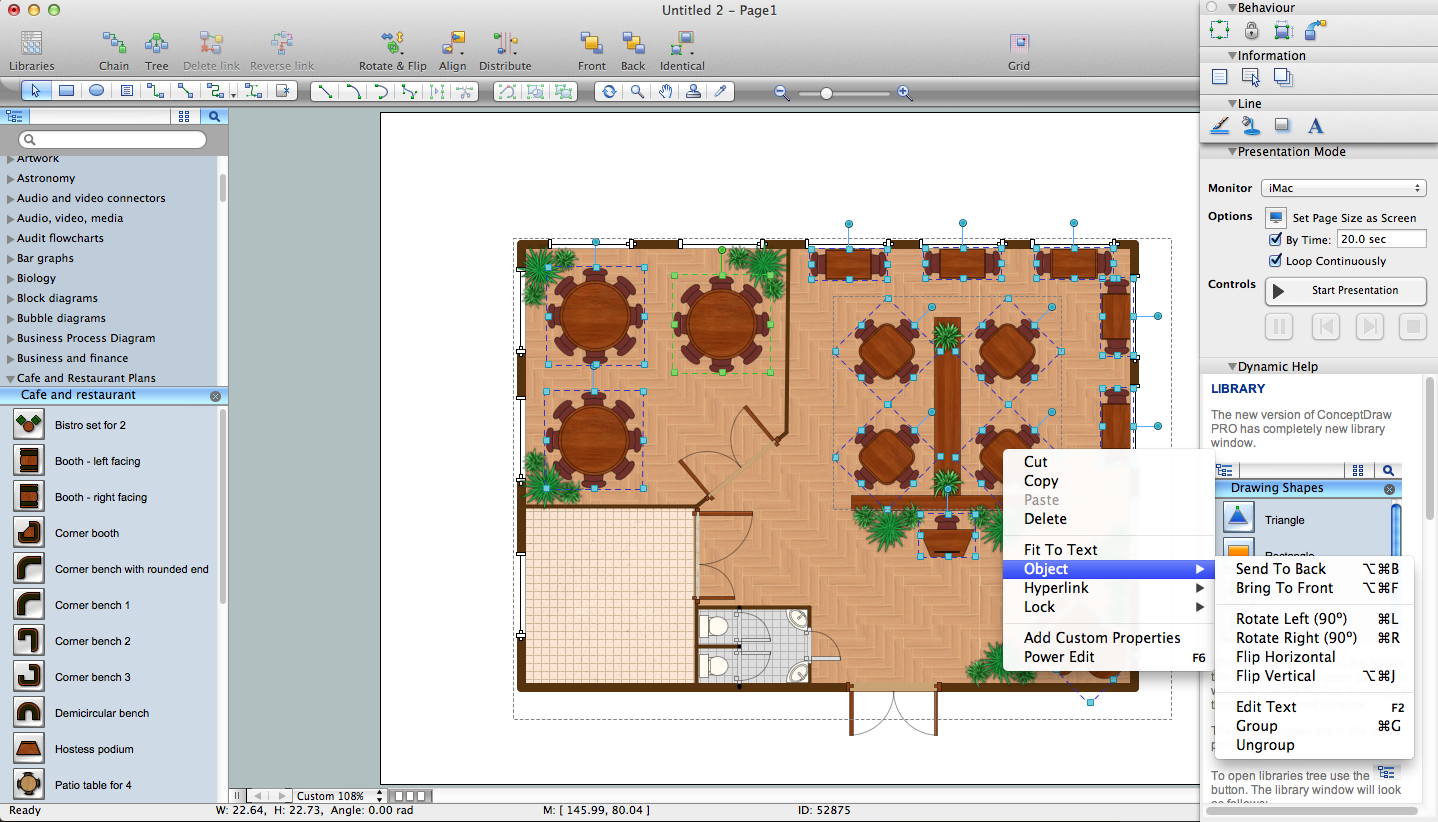
The restaurant is a beautiful place for relax and recreation. But not all the restaurants are popular. What is the secret of popularity and active visiting of some restaurant? People pay special attention for design and atmosphere, they must be pleasant and unique. All design elements, correct planning and furniture layout, location of the main hall and kitchen, beautiful music and good service, delicious dishes, create an unforgettable atmosphere of comfort, harmony, and convenience. Having a powerful ConceptDraw PRO software extended with Cafe and Restaurant Plans solution from Building Plans Area of ConceptDraw Solution Park, you can create your unique and successful Restaurant Floor plans, Restaurant layouts, and Restaurant designs in a few minutes. This solution includes a lot of Restaurant floor plan samples, examples, templates, and variety of libraries with professionally designed vector objects of different furniture, appliances, and other restaurant design elements helpful for fast and easy drawing Floor plan of restaurant.Venn Diagram Examples for Problem Solving. Venn Diagram as a Truth Table
Venn diagrams are illustrations used in the branch of mathematics known as set theory. They show the mathematical or logical relationship between different groups of things (sets). A Venn diagram shows all the possible logical relations between the sets.Types of Flowcharts
A Flowchart is a graphical representation of process, algorithm, workflow or step-by-step solution of the problem. It shows the steps as boxes of various kinds and connects them by arrows in a defined order depicting a flow. There are twelve main Flowchart types: Basic Flowchart, Business Process Modeling Diagram (BPMN), Cross Functional Flowchart, Data Flow Diagram (DFD), IDEF (Integrated DEFinition) Flowchart, Event-driven Process Chain (EPC) Diagram, Influence Diagram (ID), Swimlane Flowchart, Process Flow Diagram (PFD), Specification and Description Language (SDL) Diagram, Value Stream Mapping, Workflow Diagram. Using the Flowcharts solution from the Diagrams area of ConceptDraw Solution Park you can easy and quickly design a Flowchart of any of these types. This solution offers a lot of special predesigned vector symbols for each of these widely used notations. They will make the drawing process of Flowcharts much easier than ever. Pay also attention for the included collection of ready Flowchart examples, samples and quick-start templates. This is business process improvement tools. If you are looking for MS Visio for your Mac, then you are out of luck, because it hasn't been released yet. However, you can use Visio alternatives that can successfully replace its functions. ConceptDraw PRO is an alternative to MS Visio for Mac that provides powerful features and intuitive user interface for the same.
Illustration Software
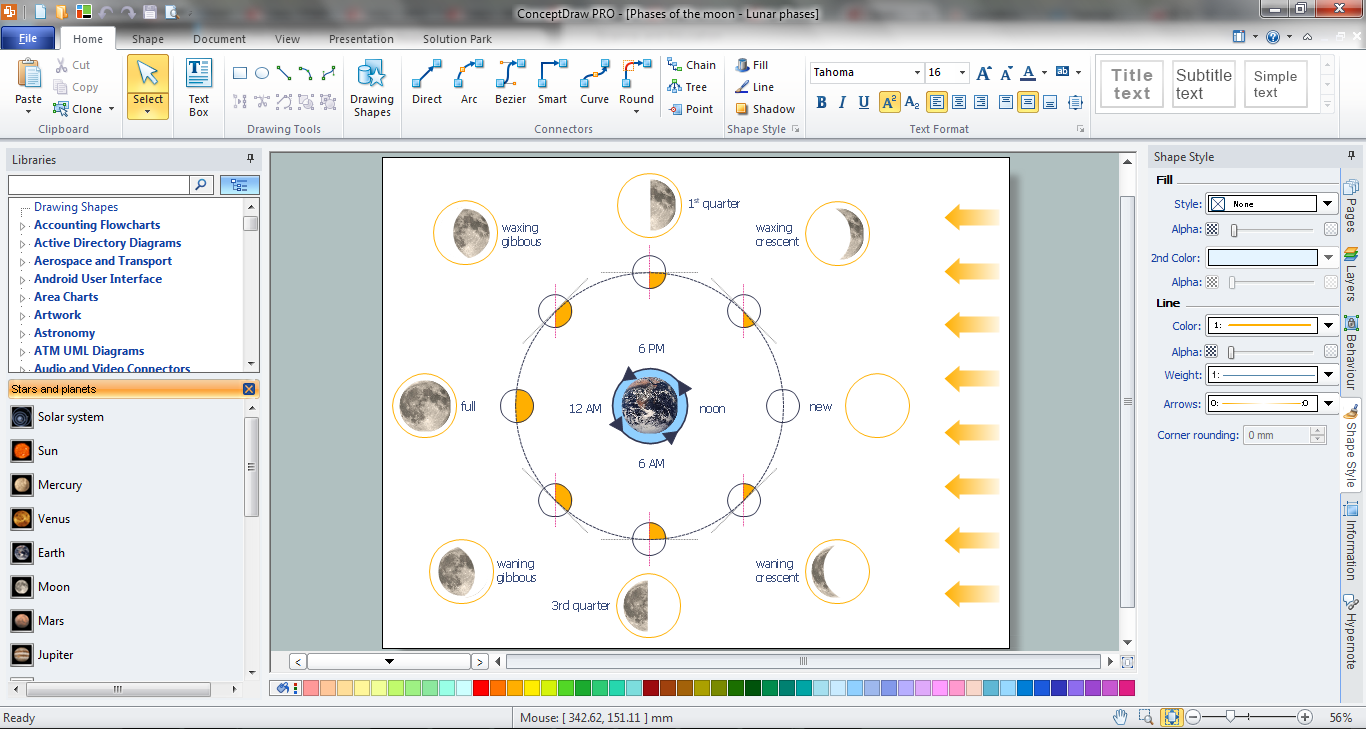
No science can't exist without illustrations, and especially astronomy! Illustrations help to visualize knowledge, natural phenomenons which are studied by astronomy, they equally effective help in work, during the learning process and on the conferences. Now we have professional astronomy illustration software - ConceptDraw PRO illustration and sketching software with templates, samples and libraries of a variety of astronomy symbols, including constellations, galaxies, stars, and planet vector shapes; a whole host of celestial bodies. When drawing scientific and educational astronomy illustrations, astronomy pictures and diagrams, can help you reach for the stars!Cross Functional Flowchart Symbols
The excellent possibility to create attractive Cross Functional Flowcharts for step-by-step visualization the operations of a business process flow of any degree of detailing is offered by ConceptDraw’s Cross-Functional Flowcharts solution. The extensive selection of commonly used vector cross functional flowchart symbols allow you to demonstrate the document flow in organization, to represent each team member’s responsibilities and how processes get shared or transferred between different teams and departments.
 Business Processes Area
Solutions of Business Processes area extend ConceptDraw PRO software with samples, templates and vector stencils libraries for drawing business process diagrams and flowcharts for business process management.
Block Diagram Creator
A block diagram is a diagram of a system in which the principal parts or functions are represented by blocks connected by lines that show the relationships of the blocks. ConceptDraw PRO diagramming and vector drawing software extended with Block Diagrams Solution from the "Diagrams" Area is a powerful Block Diagram Creator.- How To Draw A Divided Rectangle In Geography
- Divided Rectangle Graph
- How to Draw a Divided Bar Chart in ConceptDraw PRO | Basic ...
- Divided Bar Diagrams
- Representing Data On Divided Rectangles
- How to Draw a Divided Bar Chart in ConceptDraw PRO | Divided ...
- Steps Used To Draw Divided Rectangle
- Divided Bar Diagrams | How To Draw Divided Rectangle In ...
- Divided Rectangle Bar Diagram
- Thre Use Of Divided Rectangular In Geography
- Bar Chart Examples | How to Draw a Divided Bar Chart in ...
- Divided Bar Diagrams | Nature | Basic Diagramming | Divided Bar ...
- Divided bar diagram - Template | Bar Diagram Math | How to Draw a ...
- Divided Rectangular Diagram
- Divided Bar Diagrams | Basic Diagramming | Design elements ...
- Divided bar diagram - Template | Basic Diagramming | Chart ...
- How to Draw a Divided Bar Chart in ConceptDraw PRO | Bar ...
- Examples of Flowcharts, Org Charts and More | Divided Recrangular ...
- How to Draw a Divided Bar Chart in ConceptDraw PRO | Simple ...
- How to Draw a Divided Bar Chart in ConceptDraw PRO | Divided ...


