Bar Graph

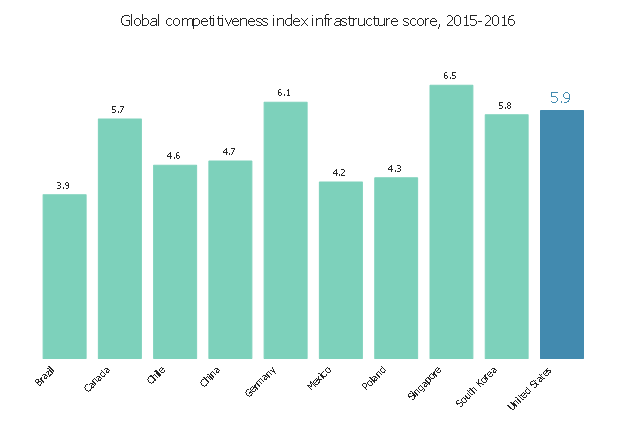
This vertical bar chart sample shows the global competitiveness index infrastructure score in 2015-2016. It was designed using data from the website "Assess Costs Everywhere (ACE)" of the United States Department of Commerce. [acetool.commerce.gov/ shipping]
"The Global Competitiveness Report (GCR) is a yearly report published by the World Economic Forum. Since 2004, the Global Competitiveness Report ranks countries based on the Global Competitiveness Index, developed by Xavier Sala-i-Martin and Elsa V. Artadi. Before that, the macroeconomic ranks were based on Jeffrey Sachs's Growth Development Index and the microeconomic ranks were based on Michael Porter's Business Competitiveness Index. The Global Competitiveness Index integrates the macroeconomic and the micro/ business aspects of competitiveness into a single index." [Global Competitiveness Report. Wikipedia]
The column graph example "Global competitiveness index infrastructure score chart" was created using the ConceptDraw PRO diagramming and vector drawing software extended with the Bar Graphs solution from the Graphs and Charts area of ConceptDraw Solution Park.
Vertical bar graph
Bar Chart Examples

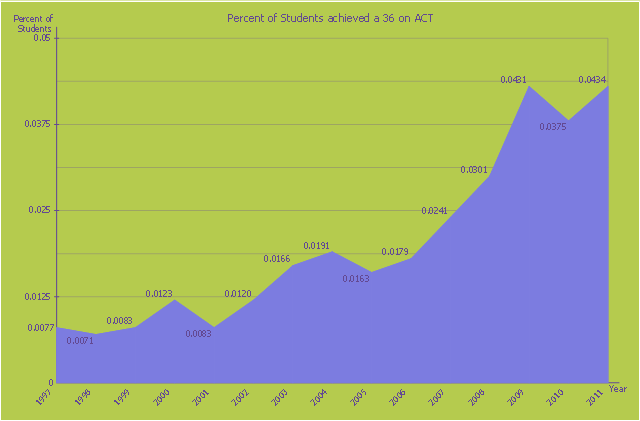
This area chart sample shows the percent of students achieved a 36 on ACT from 1997 to 2011. It was designed on the base of the Wikimedia Commons file: ACT-36-1997 to 2011.png. [commons.wikimedia.org/ wiki/ File:ACT-36-1997_ to_ 2011.png]
This file is licensed under the Creative Commons Attribution-Share Alike 3.0 Unported license. [creativecommons.org/ licenses/ by-sa/ 3.0/ deed.en]
"The ACT (originally an abbreviation of American College Testing) college readiness assessment is a standardized test for high school achievement and college admissions in the United States produced by ACT, Inc. ...
The required portion of the ACT is divided into four multiple choice subject tests: English, mathematics, reading, and science reasoning. Subject test scores range from 1 to 36; all scores are integers. The English, mathematics, and reading tests also have subscores ranging from 1 to 18. (The subject score is not the sum of the subscores.) The composite score is the average of all four tests. In addition, students taking the optional writing test receive a writing score ranging from 1 to 36 (This is a change from the previous 2–12 score range). The writing score does not affect the composite score." [ACT (test). Wikipedia]
The area graph example "Persent of Students achieved a 36 on ACT" was created using the ConceptDraw PRO diagramming and vector drawing software extended with the Area Charts solution from the Graphs and Charts area of ConceptDraw Solution Park.
Area chart
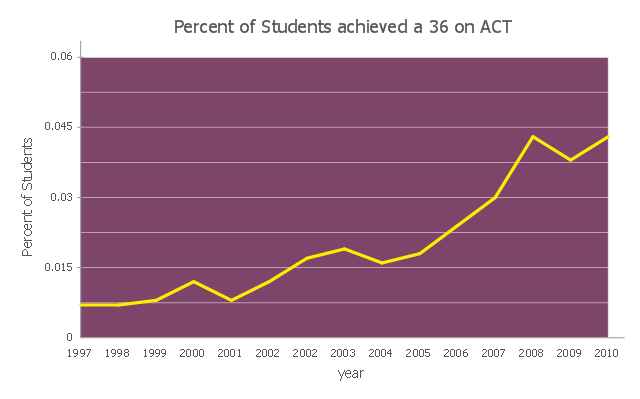
This line graph sample shows the percent of students achieved a 36 on ACT from 1997 to 2011. It was designed on the base of the Wikimedia Commons file: ACT-36-1997 to 2011.png.
[commons.wikimedia.org/ wiki/ File:ACT-36-1997_ to_ 2011.png]
This file is licensed under the Creative Commons Attribution-Share Alike 3.0 Unported license.
[creativecommons.org/ licenses/ by-sa/ 3.0/ deed.en]
"The ACT (... American College Testing) college readiness assessment is a standardized test for high school achievement and college admissions in the United States produced by ACT, Inc. It was first administered in November 1959 by Everett Franklin Lindquist as a competitor to the College Board's Scholastic Aptitude Test, now the SAT Reasoning Test. The ACT originally consisted of four tests: English, Mathematics, Social Studies, and Natural Sciences. In 1989, the Social Studies test was changed into a Reading section (which included a Social Studies subsection) and the Natural Sciences test was renamed the Science Reasoning test, with more emphasis on problem solving skills. In February 2005, an optional Writing test was added to the ACT... In the Spring of 2015, the ACT will start to be offered as a computer-based test that will incorporate some optional Constructed Response Questions; the test content, composite score and multiple choice format will not be affected by these changes. ...
All four-year colleges and universities in the U.S. accept the ACT, but different institutions place different emphases on standardized tests such as the ACT, compared to other factors of evaluation such as class rank, GPA, and extracurricular activities. The main four tests are scored individually on a scale of 1–36, and a Composite score is provided which is the whole number average of the four scores." [ACT (test). Wikipedia]
The line chart example "Percent of students achieved a 36 on ACT" was created using the ConceptDraw PRO diagramming and vector drawing software extended with the Line Graphs solution from the Graphs and Charts area of ConceptDraw Solution Park.
Line chart
Competitor Analysis

 Basic Bar Graphs
This solution enhances ConceptDraw PRO v10.3.0 (or later) with templates, samples and a library of vector stencils for drawing Bar Graphs.
Chart Maker for Presentations

Chart Examples

Create Graphs and Charts

Rainfall Bar Chart

Sales Growth. Bar Graphs Example

Bar Chart

Bar Diagrams for Problem Solving. Create economics and financial bar charts with Bar Graphs Solution

Chart Templates

- Bar Chart Examples | Bar Graph | Global competitiveness index ...
- Bar Graph | Global competitiveness index infrastructure score | Bar ...
- Bar Graph | Global competitiveness index infrastructure score | Bar ...
- Global competitiveness index infrastructure score | Create Graphs ...
- Bar Graph Score Download Pc
- Bar Graphs | Chart Examples | Chart Templates | Percentage Vs ...
- Global competitiveness index infrastructure score chart, 2012-2013
- Bar Chart Examples | Chart Examples | Global competitiveness ...
- Global competitiveness index infrastructure score | Sales ...
- 2 1 Score Vector
- Score Vector
- Regional population growth from 2010 to 2016 | Competitor Analysis ...
- Global competitiveness index infrastructure score
- Chart Examples | Line Graphs | Line Chart Examples | Percent ...
- Percent of Students achieved a 36 on ACT | Percent of students ...
- Economic Indices Bar Graph Problem Solutions
- Graph In Business Report
- Sales Growth. Bar Graphs Example | Basic Diagramming | Bar ...
- Sales Growth. Bar Graphs Example | Picture Graph | Line Graph ...
- Bar Chart Examples | Bar Graph | Business Report Pie. Pie Chart ...