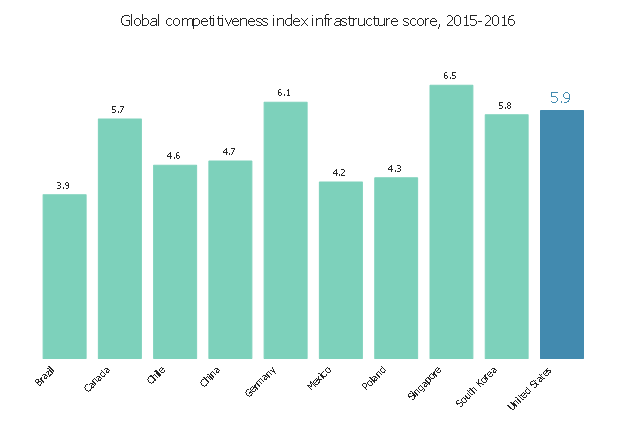
This vertical bar chart sample shows the global competitiveness index infrastructure score in 2015-2016. It was designed using data from the website "Assess Costs Everywhere (ACE)" of the United States Department of Commerce. [acetool.commerce.gov/ shipping]
"The Global Competitiveness Report (GCR) is a yearly report published by the World Economic Forum. Since 2004, the Global Competitiveness Report ranks countries based on the Global Competitiveness Index, developed by Xavier Sala-i-Martin and Elsa V. Artadi. Before that, the macroeconomic ranks were based on Jeffrey Sachs's Growth Development Index and the microeconomic ranks were based on Michael Porter's Business Competitiveness Index. The Global Competitiveness Index integrates the macroeconomic and the micro/ business aspects of competitiveness into a single index." [Global Competitiveness Report. Wikipedia]
The column graph example "Global competitiveness index infrastructure score chart" was created using the ConceptDraw PRO diagramming and vector drawing software extended with the Bar Graphs solution from the Graphs and Charts area of ConceptDraw Solution Park.
Vertical bar graph
Create Graphs and Charts

Competitor Analysis

Pyramid Chart Examples

 Website Wireframe
The innovative Website Wireframe solution enhances the ConceptDraw DIAGRAM functionality with newest wireframe tools, libraries with variety of predesigned icons, symbols, buttons, graphics, forms, boxes, and many other vector elements, templates and professionally designed samples, which make it the best wireframing software. Website Wireframe solution gives you significant advantages when designing and maintaining websites, creating skeletal and content-free depictions of website structure, making website prototypes and planning the content arrangement before committing to design, also speeds up the processes of sketching, producing and sharing wireframe examples of website style and interface design.
 Continent Maps
Continent Maps solution extends ConceptDraw DIAGRAM software with templates, samples and libraries of vector stencils for drawing the thematic maps of continents, state maps of USA and Australia.
- Bar Ghaph Recently 2016
- Bar Chart Examples | Bar Graph | Global competitiveness index ...
- Bar Graph | Global competitiveness index infrastructure score | Bar ...
- Economic Indices Bar Graph Problem Solutions
- Bar Chart Examples | Bar Graph | Soccer pictograms - Vector ...
- Bar Chart Examples | Chart Examples | Global competitiveness ...
- Global competitiveness index infrastructure score | Sales ...
- Bar Chart Examples | Bar Diagrams for Problem Solving. Create ...
- Bar Graphs | Bar Chart Software | Bar Graph | How To Graph A ...
- Bar Graph On Economics
- Growth Bar Chart
- Business Report Pie. Pie Chart Examples | Bar Chart Examples ...
- Chart Maker for Presentations | Serious crime in Cincinnati | Column ...
- Bar Graph | Line Chart Template for Word | Bar Chart | How To ...
- Sales Growth. Bar Graphs Example | Picture Graph | Line Graph ...
- Economic Problem Graphs 2016
- Bar Graph On Agriculture
- Sales Growth. Bar Graphs Example | Basic Diagramming | Bar ...
- Bar Diagrams for Problem Solving. Create economics and financial ...
- Bar Chart Template for Word | Bar Chart Examples | Rainfall Bar ...