Basic Diagramming


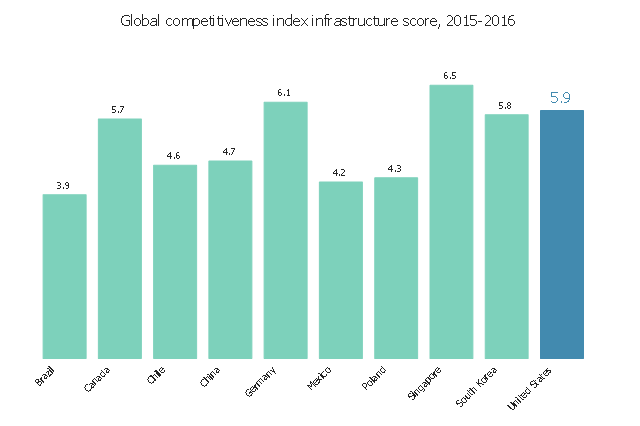
The example bar graph "Global competitiveness index infrastructure score chart, 2012-2013" was redesigned from the website "Assess Costs Everywhere" of the United States Department of Commerce. [acetool.commerce.gov/ shipping]
"The Global Competitiveness Report (GCR) is a yearly report published by the World Economic Forum. Since 2004, the Global Competitiveness Report ranks countries based on the Global Competitiveness Index, developed by Xavier Sala-i-Martin and Elsa V. Artadi. Before that, the macroeconomic ranks were based on Jeffrey Sachs's Growth Development Index and the microeconomic ranks were based on Michael Porter's Business Competitiveness Index. The Global Competitiveness Index integrates the macroeconomic and the micro/ business aspects of competitiveness into a single index." [Global Competitiveness Report. Wikipedia]
The example "Global competitiveness index infrastructure score chart, 2012-2013" was created using the ConceptDraw PRO diagramming and vector drawing software extended with the Bar Graphs solution from the Graphs and Charts area of ConceptDraw Solution Park.
www.conceptdraw.com/ solution-park/ charts-bar-graphs
Horizontal Bar Graph
- Picture graph - Population growth by continent, 2010 - 2013 | Basic ...
- Picture graph - Population growth by continent, 2010 - 2013 | Basic ...
- Picture graph template | Picture graph - Population growth by ...
- Scatter Chart Examples | How to Create a Scatter Chart | Scatter ...
- Basic Diagramming |
- The Best Drawing Program for Mac | Bar Chart Software | Column ...
- Divided bar diagram template
- Picture graph - Population growth by continent, 2010 - 2013 ...
- Line Chart Examples | Chart Examples | Picture Graphs |
- Scatter Chart Examples | How to Create a Scatter Chart | Scatter ...
- Picture graph template | Picture Graphs | Bar Chart Software |
- Bar Chart Software | Bar Chart Examples | The Best Drawing ...
- Bar Chart Examples | Bar Chart Software | How to Create a Bar Chart |
- Bar Chart Examples | Column Chart Software | How to Create a Bar ...
- Divided bar diagram template
- Bar Chart Software | Bar Chart Examples | Bar chart template |
- Bar Chart Examples | Bar Chart Software | Bar Graphs |
- Area chart template | Area chart - San Francisco population history ...
- How to Draw an Organization Chart | Gant Chart in Project ...
- Create Graphs and Charts | Army Flow Charts | LLNL Flow Charts |