This circle diagram sample was redesigned from the Wikimedia Commons file: Research cycle.png. "Some of the basic elements of the scientific method, arranged in a cycle to emphasize that it is an iterative process." [commons.wikimedia.org/ wiki/ File:Research_ cycle.png]
This file is licensed under the Creative Commons Attribution 2.0 Generic license. [creativecommons.org/ licenses/ by/ 2.0/ deed.en]
"The scientific method is a body of techniques for investigating phenomena, acquiring new knowledge, or correcting and integrating previous knowledge. To be termed scientific, a method of inquiry must be based on empirical and measurable evidence subject to specific principles of reasoning. ...
Four essential elements of the scientific method are iterations, recursions, interleavings, or orderings of the following:
(1) Characterizations (observations, definitions, and measurements of the subject of inquiry).
(2) Hypotheses (theoretical, hypothetical explanations of observations and measurements of the subject).
(3) Predictions (reasoning including logical deduction from the hypothesis or theory).
(4) Experiments (tests of all of the above)...
A linearized, pragmatic scheme of the four points above is sometimes offered as a guideline for proceeding:
(1) Define a question.
(2) Gather information and resources (observe).
(3) Form an explanatory hypothesis.
(4) Test the hypothesis by performing an experiment and collecting data in a reproducible manner.
(5) Analyze the data.
(6) Interpret the data and draw conclusions that serve as a starting point for new hypothesis.
(7) Publish results.
(8) Retest (frequently done by other scientists).
The iterative cycle inherent in this step-by-step method goes from point 3 to 6 back to 3 again." [Scientific method. Wikipedia]
The circle diagram example "Research cycle" was created using the ConceptDraw PRO diagramming and vector drawing software extended with the Target and Circular Diagrams solution from the Marketing area of ConceptDraw Solution Park.
www.conceptdraw.com/ solution-park/ marketing-target-and-circular-diagrams
Circle diagram

SWOT Sample in Computers

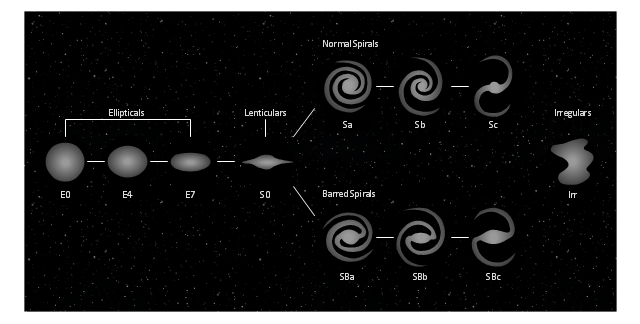
This tuning-fork style diagram of the Hubble sequence was created on the base of the Wikimedia Commons file: Hubble sequence photo.png. [commons.wikimedia.org/ wiki/ File:Hubble_ sequence_ photo.png]
"The Hubble sequence is a morphological classification scheme for galaxies invented by Edwin Hubble in 1936. It is often known colloquially as the Hubble tuning fork diagram because of the shape in which it is traditionally represented.
Hubble’s scheme divides regular galaxies into 3 broad classes - ellipticals, lenticulars and spirals - based on their visual appearance (originally on photographic plates). A fourth class contains galaxies with an irregular appearance. To this day, the Hubble sequence is the most commonly used system for classifying galaxies, both in professional astronomical research and in amateur astronomy." [Hubble sequence. Wikipedia]
The astronomical diagram example "Tuning-fork style diagram of the Hubble sequence" was created using the ConceptDraw PRO diagramming and vector drawing software extended with the Astronomy solution from the Science and Education area of ConceptDraw Solution Park.
Morphological classification scheme for galaxies
Marketing Plan Infographic

Local area network (LAN). Computer and Network Examples
. Computer and Network Examples")

Skype as eLearning Platform


 Fishbone Diagram
Fishbone Diagrams solution extends ConceptDraw PRO software with templates, samples and library of vector stencils for drawing the Ishikawa diagrams for cause and effect analysis.
Biology Drawing Software

Personal area (PAN) networks. Computer and Network Examples
 networks. Computer and Network Examples")
Basic Flowchart Symbols and Meaning


 eLearning for Skype
This solution extends ConceptDraw MINDMAP software with the ability to prepare and run remote learning sessions by using Skype
 Stakeholder Onion Diagrams
The Stakeholder Onion Diagram is often used as a way to view the relationships of stakeholders to a project goal. A basic Onion Diagram contains a rich information. It shows significance of stakeholders that will have has influence to the success achieve
Metropolitan area networks (MAN). Computer and Network Examples
. Computer and Network Examples")
How to Make SWOT Analysis in a Word Document

- Science Research Png
- Circle Diagram Png
- Genetics Png
- Elements location of a welding symbol | Research cycle - Circle ...
- Research cycle - Circle diagram | Export from ConceptDraw PRO ...
- Research cycle - Circle diagram | Flowchart design. Flowchart ...
- Scientific Vector Png
- Research cycle - Circle diagram | Business feedback loop | Life ...
- Business feedback loop | Research cycle - Circle diagram | Life ...
- PDCA cycle | Research cycle - Circle diagram | Life cycle of an ...
- Research Vector Art Png
- Research cycle - Circle diagram | DroidDia PRO unlocker | Porter ...
- Research cycle - Circle diagram | 3 Circle Venn Diagram. Venn ...
- Growth Png Clipart
- Meeting Cartoon Png
- Earth Illustration Png
- Blue Wedding Background Design Png
- Astronaut Illustration Png
- Plus And Minus Sign Png Firm Cartoon
- Moon Rover Png