How To Make the Right Decision in Projects
A key point of conference success is the ability to see slides in real time, and hold documented discussions during the meeting. Remote Presentation for Skype is a new solution allows real-time presenting that benefits work groups who need collaborate by web meetings.
Decision Making Software For Small Business
A software tool that saves your time on making decisions now has the ability to make decisions with remote team via Skype.
Workflow Diagram
Workflow diagram is a perfect tool to represent visually a repeatable pattern of organizational activity that is powered by resources and to describe in details the transferring of data, documents or tasks during a work process. It effectively explains and documents the process flow that exists and that requires the studying, analyzing and execution. Workflow diagrams help to represent the working processes in a simple visual manner, to follow easy the path of a task in a workflow, to identify the persons responsible for the execution of each stage, to show the accompanied documents and needed resources. All this helps to optimize the workflow and to discover its weak points. Workflow diagrams are mainly designed and used as a part of project documentation, certification process and company policies to comply the standards. To design professionally the Workflow diagrams, use the ConceptDraw DIAGRAM software. Enhanced with Workflow Diagrams solution from the Business Processes area, the ConceptDraw DIAGRAM it is a powerful workflow diagram maker.Decision Making
Decision Making - ConceptDraw Office suite provides visual tools that are given support on the stage of the decision making. The Seven Management and Planning Tools is a set for such diagrams: Affinity Diagram, Relations Diagram, Prioritization Matrix, Root Cause Tree Diagram, Involvement Matrix, PERT Chart, Risk Diagram (PDPC).
SWOT Analysis Solution - Strategy Tools
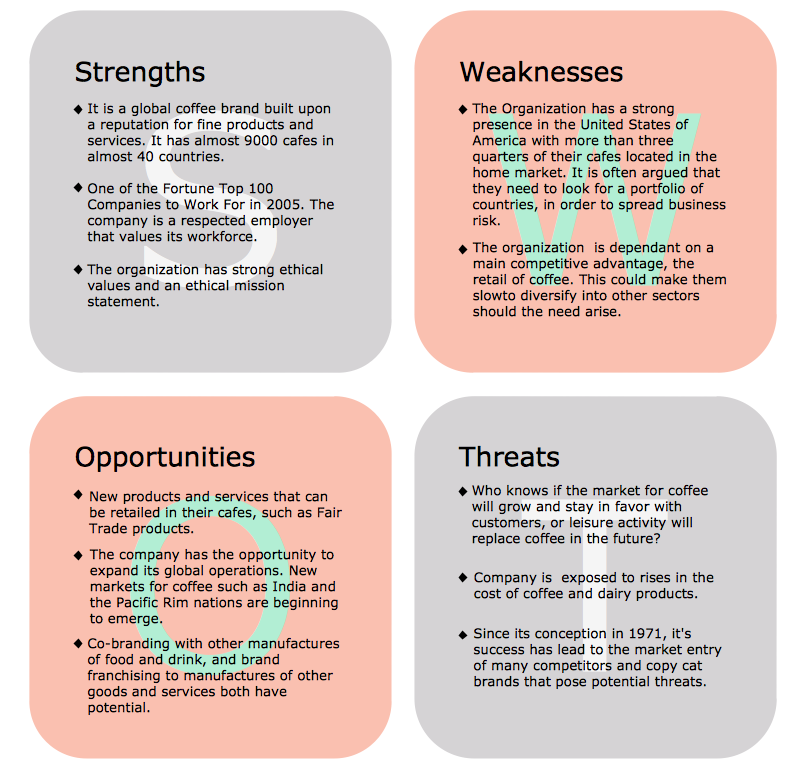
The condition and successful development of the company depends on how efficiently it is able to react on different outside influences. Analysis and interrelated consideration of external factors and the company's capabilities allow effectively solve appearing problems. One of the most common methods of evaluation together internal and external factors influencing the company's development is SWOT analysis elaborated for business and industry. It is a necessary element of researches and obligatory preliminary stage at the preparation of strategic and marketing plans of the company. Upon the results of SWOT analysis, we can assess does the company have the internal forces and resources to realize the existing opportunities and resist external threats, and what internal deficiencies require the prompt rectification. ConceptDraw DIAGRAM software enhanced with SWOT Analysis solution offers powerful drawing and strategy tools for effective execution the SWOT and TOWS analysis for your company with a goal of effectively realizing strategic planning and correct decision-making.Sections of the Value Stream Map
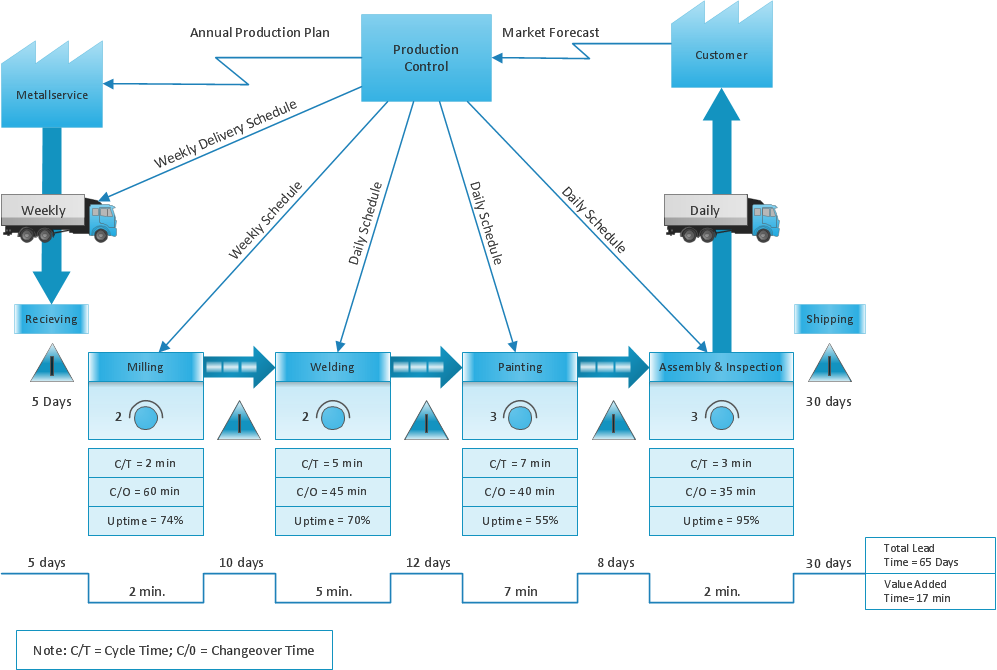
The Value Stream Mapping solution extends ConceptDraw DIAGRAM software with a new library that contain vector objects, samples and templates.Tool for Workgroup Briefings, Meetings and Decisions
A key point of conference success is the ability to see slides in real time, and hold documented discussions during the meeting. Remote Presentation for Skype is a new solution allows real-time presenting that benefits work groups who need collaborate by web meetings.
Network Visualization with ConceptDraw DIAGRAM
ConceptDraw makes the entire process of network visualization easier thanks to the numerous ready-to-use objects included in the package for presentation of network equipment, LDAP directory symbols and many other objects that symbolize resources in most various representations.IDEF3 Standard
Use Case Diagrams technology. IDEF3 Standard is intended for description and further analysis of technological processes of an enterprise. Using IDEF3 standard it is possible to examine and model scenarios of technological processes.A Tool for EffectiveTeam Meetings
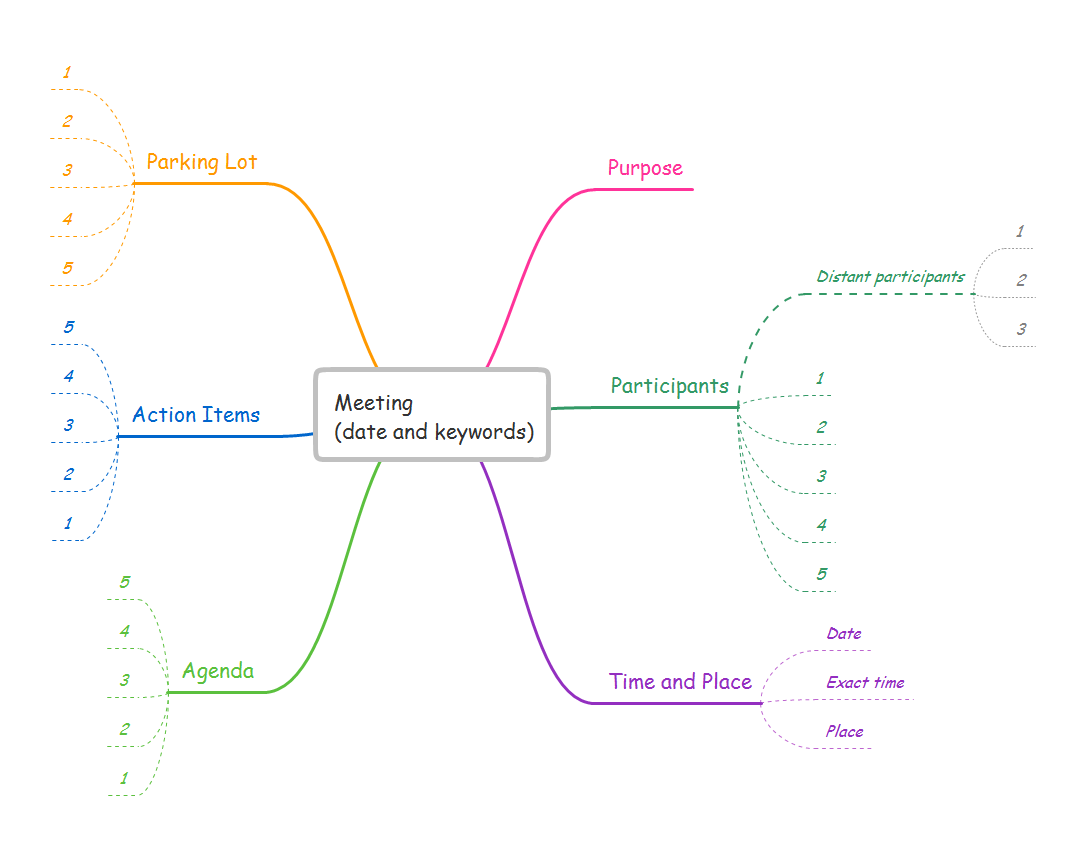
Use team meetings, share ideas, brainstorm ideas, team notes with ConceptDraw solution.
What is SWOT Analysis in Marketing
What is SWOT analysis in marketing? SWOT analysis gives for analysts, marketing specialists and other professionals the perfect ability to identify the positives and negatives in an organization, as well as in the external environment. The SWOT and TOWS methods were developed for business and industry, they involve the specifying of a project's objective and identifying internal and external causes for accomplishing the project goals. A full awareness about the situation within and around your business can help effectively with both strategic planning and decision-making. ConceptDraw DIAGRAM and ConceptDraw MINDMAP software allow professionals to make the situation analysis, to develop strategies and plans for achievement defined objectives, to suppose the possible scenarios of further activity, to see the whole situation at a glance, to create well-designed SWOT and TOWS matrices in minutes. The SWOT and TOWS Matrix Diagrams solution from ConceptDraw Solution Park includes the SWOT matrix samples and templates that allow users quickly create their own SWOT and TOWS diagrams.Quality Mind Maps - samples and templates
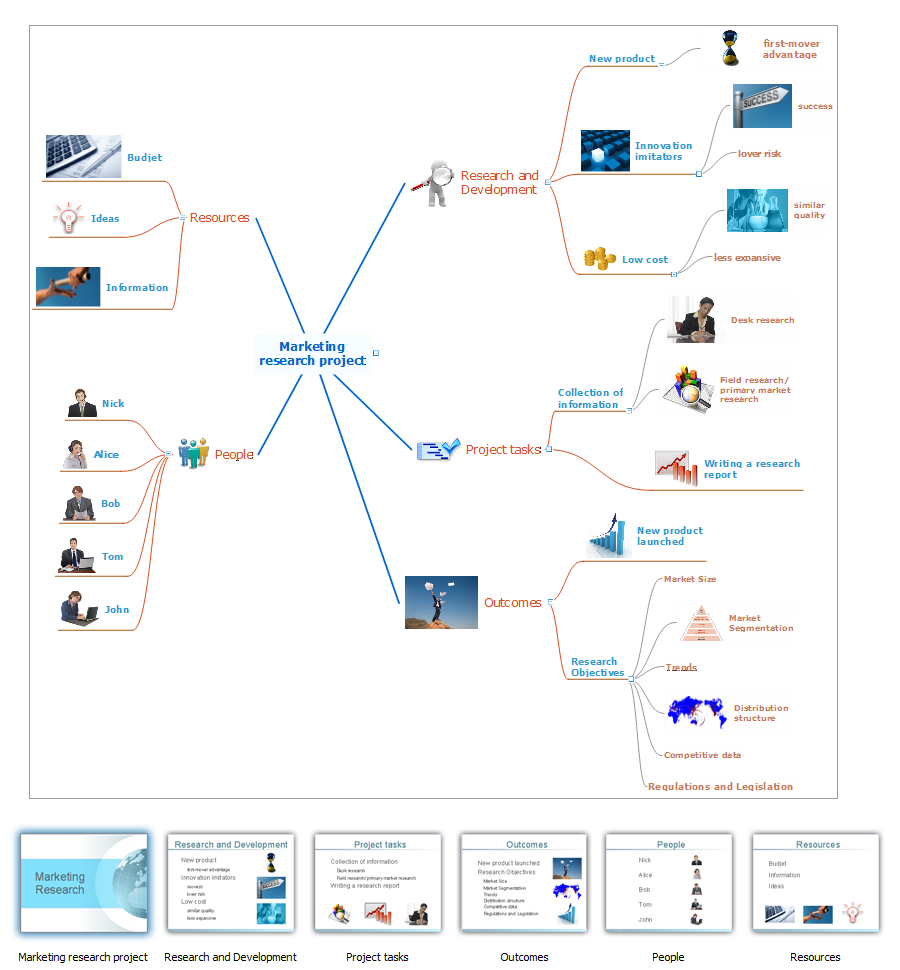
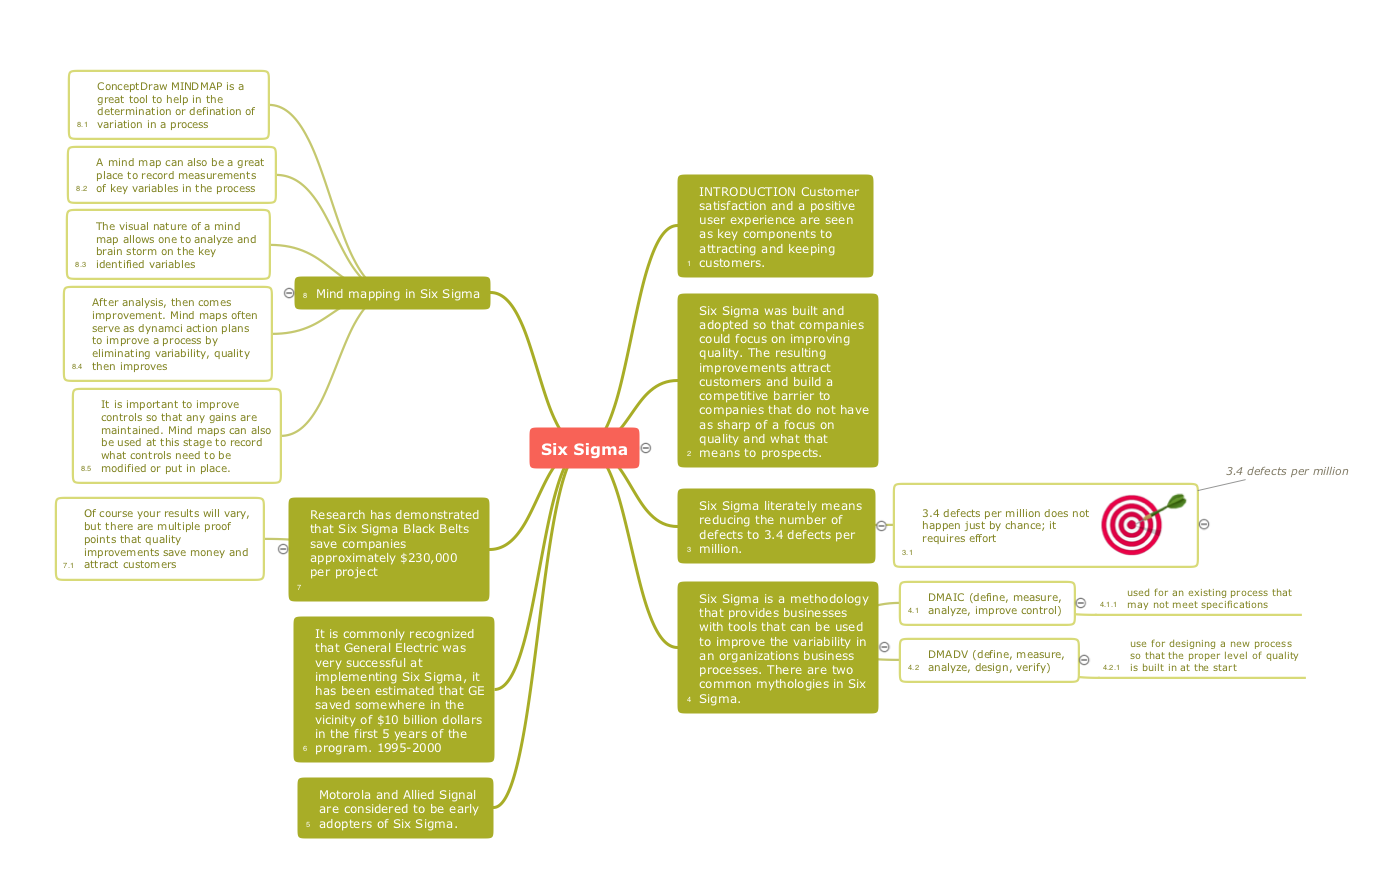
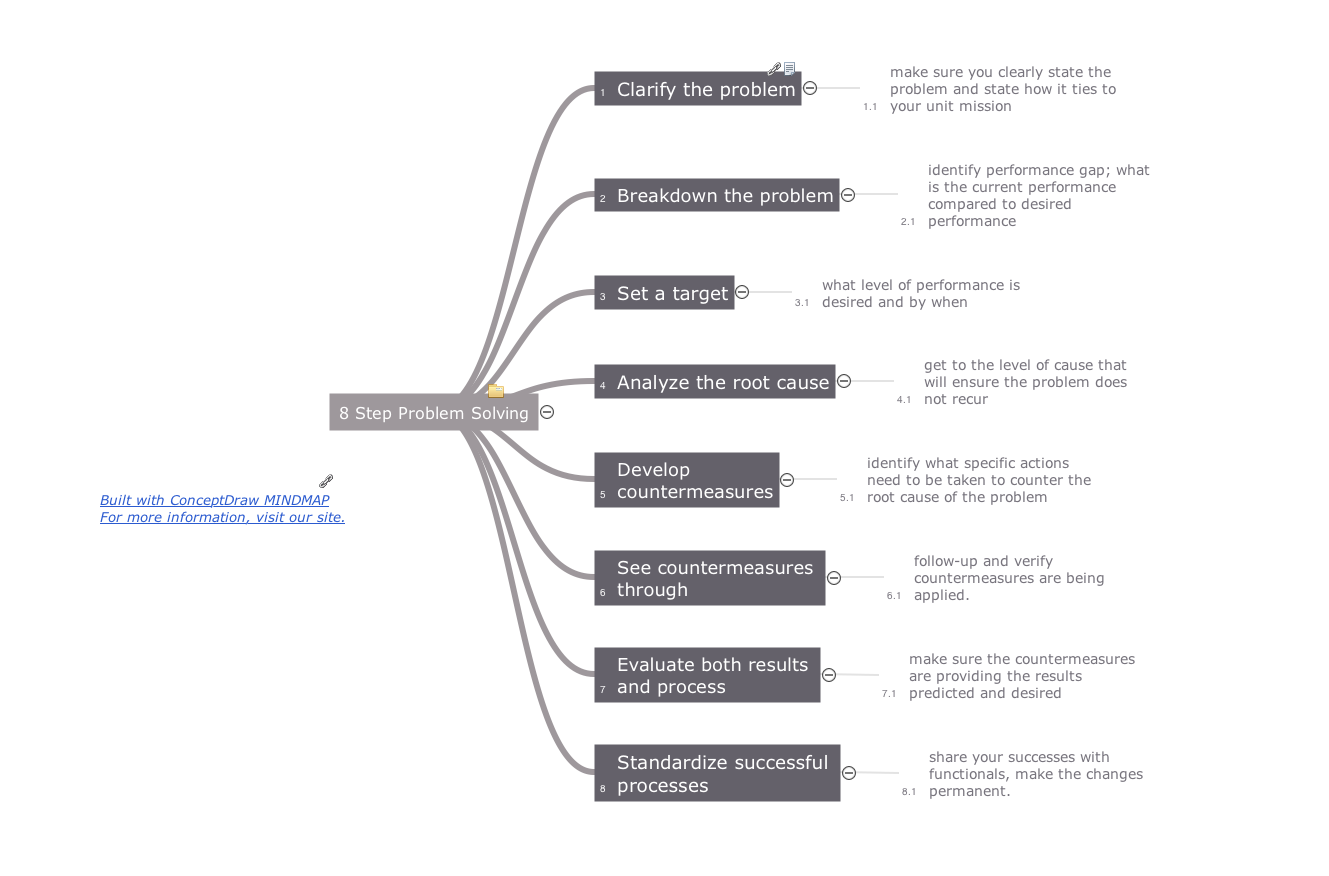
Use samples and templates to describe your own quality processes, brainstorm, and structure quality issues.Value Stream Diagram
The new Value Stream Mapping solution found in the ConceptDraw Solution Park continues to extend the range of ConceptDraw DIAGRAM into a business graphics tool.Helpful in all stages of quality management
ConceptDraw Mind maps can be used to depict a quality process.The Fifty Two Elements of TQM
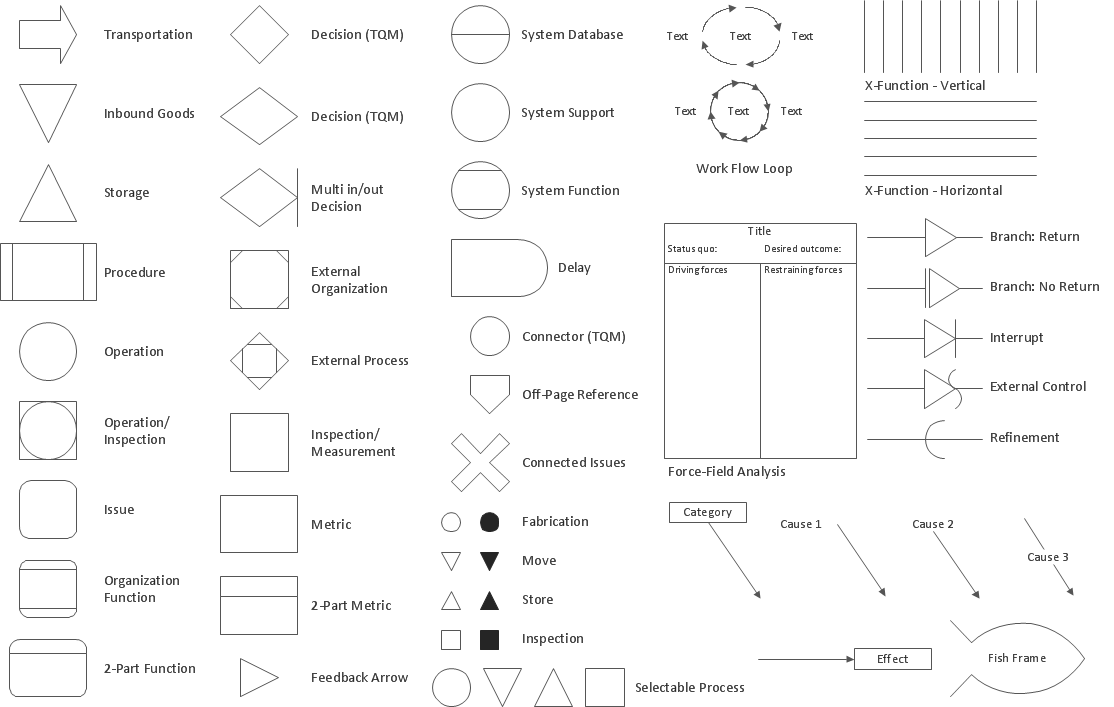
The Total Quality Management Diagram solution helps your organization visualize business and industrial processes. Create Total Quality Management diagrams for business process with ConceptDraw software.SWOT Analysis Software
SWOT analysis is a powerful tool that helps the business professionals to identify the positives and negatives within an organization and in an external environment. TOWS is a variation of SWOT analysis, more focused on external factors and action planning. The correct and full awareness of the situation is important for strategic planning, as well as for decision making and coordination the company's resources and information capabilities of the competitive environment. SWOT and TOWS Matrix Diagrams solution included to ConceptDraw Solution Park makes the ConceptDraw DIAGRAM a powerful SWOT Analysis software and provides a lot of advantages. First of all note the set of ready-made templates that help to identify the Strengths, Weaknesses, Opportunities, and Threats the most quickly and effectively, and the choice of outputs to present the analysis results as SWOT or TOWS matrix. The well-designed SWOT matrix samples and examples included to SWOT and TOWS Matrix Diagrams solution illustrate the results you can achieve using it and also can be used as a good start for your own matrices.Quality Engineering Diagrams
Create Quality Engineering Diagrams (value stream maps) - for value stream analysis and value stream management, material and information flow mapping, using our quick start templates included with ConceptDraw.- Mind Maps for Business - SWOT Analysis | Decision Making ...
- How To Make the Right Decision in Projects | Decision Making ...
- Decision Making Software For Small Business
- Decision Making | Seven Management and Planning Tools | Marketing
- Decision Making | Cross-Functional Flowchart | Risk Analysis |
- Decision Making | Decision Making Software For Small Business ...
- Program for Making Presentations | Decision Making Software For ...
- Seven Management and Planning Tools | Decision Making ...
- Decision Making | IDEF3 Standard | Basic Flowchart Symbols |
- Seven Management and Planning Tools | Decision Making | The ...
- Quality Mind Maps - samples and templates | Quality Mind Map
- How To Make the Right Decision in Projects | Flowchart Software ...
- One formula of professional mind mapping : input data + output data ...
- PROBLEM ANALYSIS Prioritization Matrix | Decision Making ...
- Process decision program chart (PDPC) - Personal activity | Risk ...
- PROBLEM ANALYSIS Root Cause Analysis tree Diagram | Root Cause ...
- Management | Business Productivity Area | Business Processes ...
- Professional & Powerful Mind Mapping Software | One formula of ...
- Decision Making | Block diagram - Customer decision making | Work ...
- Quality Management Teams


