This site uses cookies. By continuing to browse the ConceptDraw site you are agreeing to our Use of Site Cookies.

Check Order Process Flowchart. Flowchart Examples

This sample was created in ConceptDraw DIAGRAM diagramming and vector drawing software using the Flowcharts solution from the Diagrams area of ConceptDraw Solution Park. This sample shows the Flowchart of the printing the elements of the binary search tree. They are printed in the order from lowest to greatest. On this diagram you can see the rectangles that represent the steps and decision points that are represented as diamonds with questions. It is necessary to make the decision that will determine the next step.

Work Order Process Flowchart. Business Process Mapping Examples

The business process is a set of actions or tasks which are undertaken by an organization for production some goods or services, they are then offered for the customers and are ordered by them. Process Flowcharts and Order Process Flowcharts are sufficiently prevalent, well known and actively used in variety of fields of life, business and science. They are constructed using the common standardized symbols, thus are clear and understandable for all. They help effectively represent the processes, determine the order in which the process activities happen, document the order processes, and also effectively analyze the processes with a goal to increase their efficiency. Create your own Process Flowcharts, Order Process Flowcharts, Cross-Functional Flow Charts representing the order processing steps using powerful drawing tools of ConceptDraw DIAGRAM software and variety of predesigned vector objects from the libraries of Business Process Mapping Solution from Business Processes area of ConceptDraw Solution Park.

Basic of Flowchart: Meaning and Symbols

Flowcharts are the best for visually representation the business processes and the flow of a custom-order process through various departments within an organization. ConceptDraw DIAGRAM diagramming and vector drawing software extended with Flowcharts solution offers the full set of predesigned basic flowchart symbols which are gathered at two libraries: Flowchart and Flowcharts Rapid Draw. Among them are: process, terminator, decision, data, document, display, manual loop, and many other specific symbols. The meaning for each symbol offered by ConceptDraw gives the presentation about their proposed use in professional Flowcharts for business and technical processes, software algorithms, well-developed structures of web sites, Workflow diagrams, Process flow diagram and correlation in developing on-line instructional projects or business process system. Use of ready flow chart symbols in diagrams is incredibly useful — you need simply drag desired from the libraries to your document and arrange them in required order. There are a few serious alternatives to Visio for Mac, one of them is ConceptDraw DIAGRAM. It is one of the main contender with the most similar features and capabilities.
How to Build a Flowchart

Flowcharts

We have a lot of samples of flowchart diagrams for your needs.

Material Requisition Flowchart. Flowchart Examples

Material requisition is a request generated by internal or external organization with a goal to inform the purchase department about the needed items and materials. The requisition can be represented as a written document on a pre-printed form or online request in form of electronic document. The electronic inquisition occupies a leading position in a modern world, now the paper forms are replaced by electronic ordering processes and workflows. The requisition is actively used in business as an internal document for notification the store about the needed goods, in medicine for making the orders on medical equipment and medicaments, in industry for creation request for purchasing some items and materials, and so on. ConceptDraw DIAGRAM ector graphics software extended with Flowcharts solution from the Diagrams area is powerful and useful tool for drawing various types of Flowcharts, including without doubt the Material Requisition Flowchart of any degree of detailing. Succeed in drawing using the large quantity of predesigned flowchart specific shapes, symbols and icons.

Example Process Flow Chart

ConceptDraw DIAGRAM is a powerful diagramming and vector drawing software. Extended with Flowcharts solution from the "Diagrams" area, ConceptDraw DIAGRAM became the ideal software for making an example Process Flow Chart.

Why flowchart is important to accounting information system?

Flowcharts are used to represent accounting information in a system. There are special symbols which are used to create accounting flowcharts.

Contoh Flowchart

The Flowcharts are graphical representations of algorithms, processes or step-by-step solutions problems. There are many different types of Flowcharts, among them Process Flowchart, Cross Functional Flowchart, Data Flow Diagram, IDEF Flowchart, Workflow Diagram, Contoh Flowchart and many others. They have especial value when you need represent a complex process, depict in details the process of solution problems, efficiently plan and set the tasks priorities. The Flowcharts must to be constructed brief, clear and logical, simplifying the process or procedure, and making easier the comprehension and perception of information. The ConceptDraw DIAGRAM software makes the process of creating the flowcharts of any types well organized and clear for developers and customers also, including the Contoh Flowchart. It is possible due to the Flowcharts solution from ConceptDraw Solution Park, its predesigned vector objects, templates, and a lot of professional-looking practical samples and examples which can be quick and easy modified, printed, or published on web.
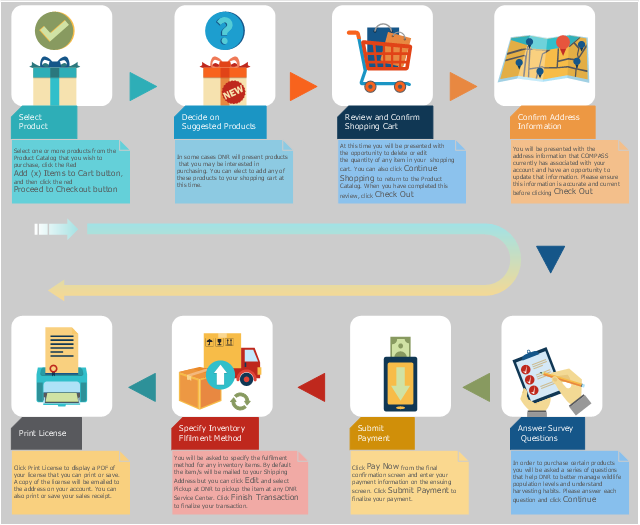
This example was created on the base of the hunting and fishing license sales flowchart from the COMPASS portal of the Department of Natural Resources, Maryland, U.S.
[compass.dnr.maryland.gov/ Help/ Topic/ ViewTopic/ ExecutingaSalesTransaction]
The COMPASS portal "allow you quick and easy access to hunting and fishing licenses, regulations and other important information about outdoor recreation in Maryland." [compass.dnr.maryland.gov/ DnrCompassPortal]
The example "Hunting and fishing license sales flowchart" was created using the ConceptDraw PRO diagramming and vector drawing software extended with the Sales Flowcharts solution from the Marketing area of ConceptDraw Solution Park.
Sales flowchart
Sales flowchart, vertical moving arrow, u shaped arrow, triangle arrow, sales orders, question, product, page, online payment, new products, invoice, full shopping cart, exporting, empty shopping cart, double arc arrow, distribution, copy center, checkbox, card,

Sales Analytics

With Sales Dashboard solution for ConceptDraw DIAGRAM sales analytics become as simple and visual as never before. Visualizing sales data using ConceptDraw Sales Dashboard allows you keep all KPI on the one page and see how your business can improve.

Basic Flowchart Images. Flowchart Examples

This sample was created in ConceptDraw DIAGRAM diagramming and vector drawing software using the Flowcharts solution from the Diagrams area of ConceptDraw Solution Park. This sample shows the Flowchart that displays the procedures of 2PP (two-party preferred) voting and counting the voters. The two-party-preferred vote is the result of the elections that was distributed to the final two parties.

UML in 10 mins

It’s very simple and quick to create the UML Diagrams using the Rapid UML Solution for ConceptDraw DIAGRAM. This sample was created in 10 minutes. This sample describes the credit card processing system. It’s a UML Class Diagram with generalization sets. This sample can be used by the banks, business and financial companies, exchanges.

Processing Flow Chart

Processing Flow Chart is a simplified sketch which is used in chemical and process engineering for illustrating general plant streams, major equipments and key control loops.

ConceptDraw DIAGRAM enhanced with Flowcharts Solution from the "Diagrams" Area of ConceptDraw Solution Park is a powerful Processing Flow Chart software which will help save lots of your time.

Business diagrams & Org Charts with ConceptDraw DIAGRAM

The business diagrams are in great demand, they describe the business processes, business tasks and activities which are executed to achieve specific organizational and business goals, increase productivity, reduce costs and errors. They let research and better understand the business processes. ConceptDraw DIAGRAM is a powerful professional cross-platform business graphics and business flowcharting tool which contains hundreds of built-in collections of task-specific vector stencils and templates. They will help you to visualize and structure information, create various Business flowcharts, maps and diagrams with minimal efforts, and add them to your documents and presentations to make them successful. Among them are Data flow diagrams, Organization charts, Business process workflow diagrams, Audit flowcharts, Cause and Effect diagrams, IDEF business process diagrams, Cross-functional flowcharts, PERT charts, Timeline diagrams, Calendars, Marketing diagrams, Pyramids, Target diagrams, Venn diagrams, Comparison charts, Analysis charts, Dashboards, and many more. Being a cross-platform application, ConceptDraw DIAGRAM is very secure, handy, free of bloatware and one of the best alternatives to Visio for Mac users.
Draw Business Process Diagrams

What process should be essentially adopted. Accounting Flowchart Example

The Accounting flowchart shows how information flows from source documents through the accounting records. The are based on the accounting procedures or processes.

Pyramid Diagram and Pyramid Chart

Pyramid Diagram, Triangle Chart or Triangular Diagram is a convenient and useful type of diagrams, which lets represent the data hierarchical structure and to illustrate the foundation-based relationships between the hierarchy levels. Pyramid Diagrams are used to visualize effectively the hierarchical, as well as proportional and foundation-based relationships, the process steps, the interconnections of organizational layers or topics. ConceptDraw DIAGRAM software enhanced with Pyramid Diagrams solution from Marketing area of ConceptDraw Solution Park is a powerful business charting software, that includes all required tools for designing the multilevel Pyramid Diagrams as quickly as possible. The build-in vector stencils and templates are the great aid for designers, a variety of examples and samples is a good base and source of inspiration. Use attractive and vivid 2D and 3D Pyramid Diagrams and Triangle Charts designed in ConceptDraw DIAGRAM to illustrate your documents, presentations, infographics, articles, reports, websites, etc.

sales process map, sales process flowchart, sales steps, sales process management Sales Flowcharts

sales process map, sales process flowchart, sales steps, sales process management
The Sales Flowcharts solution lets you create and display sales process maps, sales process workflows, sales steps, the sales process, and anything else involving sales process management.

Basic Flowchart Examples

ConceptDraw DIAGRAM is a business flowchart software includes the wide flowchart examples package.

Accounting Flowchart Symbols

Accounting is a well known and popular tool used for gaining full quantitative information about the finances. The accounting process includes extensive set of activities that begins with transactions and ends with closing of books. It contains all financial information for a given organization, the data about incomes, expenditures, purchases, sales, return, payroll, and many other numerical information. The excellent possibility to create great-looking Accounting Flowcharts is offered by professional ConceptDraw DIAGRAM diagramming and vector drawing software. It includes the Accounting Flowcharts solution containing wide variety of predesigned accounting flowchart symbols. All symbols are easy recognizable, commonly used, vector and professionally designed, so are capable effectively save your time and efforts when representing all stages of accounting work process, the flow of data in an organization, accounting procedures and processes, documents, tasks, responsible people, users, components and authorizations.

Column Chart Template

Column chart templates from ConceptDraw collection can help you find the best visual depiction for you data. You can easily modify column chart templates according to data you want to visualize.