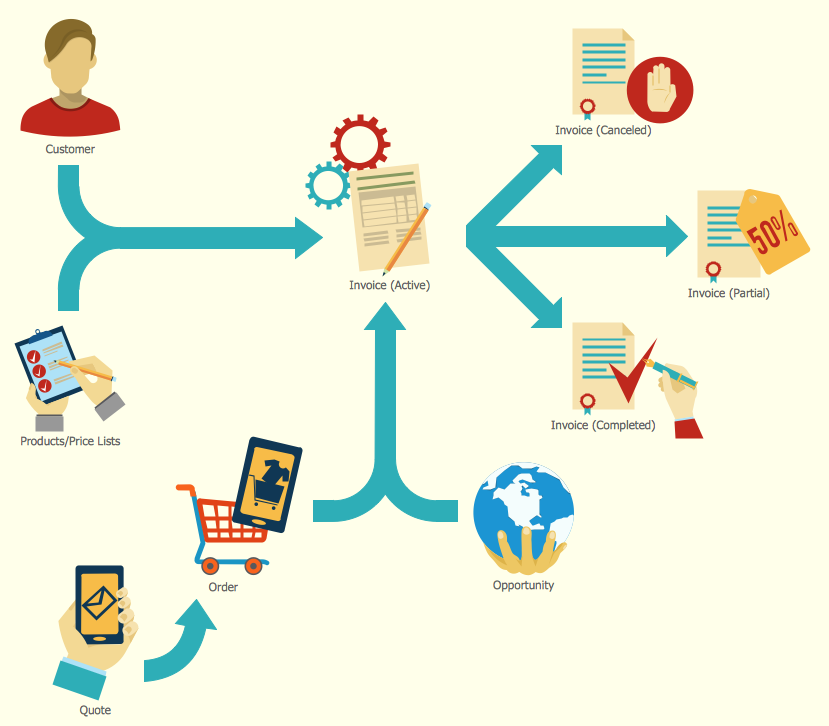
Sales Process Flowchart. Flowchart Examples

Sales Process Flowchart Symbols

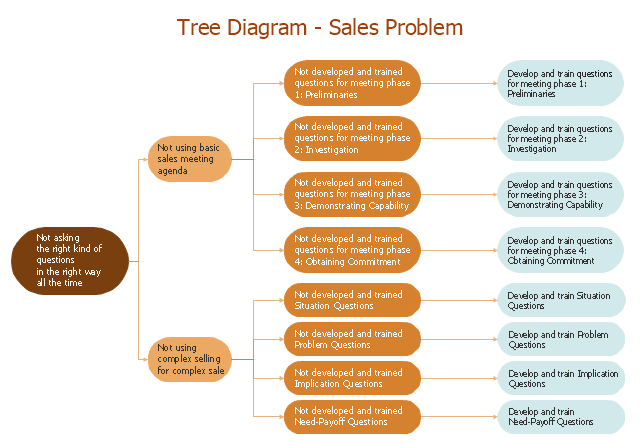
"Root cause analysis (RCA) is a method of problem solving that tries to identify the root causes of faults or problems. ...
RCA (in steps 3, 4 and 5) forms the most critical part of successful corrective action, because it directs the corrective action at the true root cause of the problem. Knowing the root cause is secondary to the goal of prevention, but without knowing the root cause, it is not possible to determine what an effective corrective action for the defined problem would be. ...
3. Ask "why" and identify the causes associated with each step in the sequence towards the defined problem or event. "Why" is taken to mean "What were the factors that directly resulted in the effect?"
4. Classify causes into causal factors that relate to an event in the sequence and root causes, that if eliminated, can be agreed to have interrupted that step of the sequence chain.
5. Identify all other harmful factors that have equal or better claim to be called "root causes." If there are multiple root causes, which is often the case, reveal those clearly for later optimum selection." [Root cause analysis. Wikipedia]
This root cause analysis (RCA) tree diagram example "Sale problem solution" was created using the ConceptDraw PRO diagramming and vector drawing software extended with the Seven Management and Planning Tools solution from the Management area of ConceptDraw Solution Park.
RCA diagram
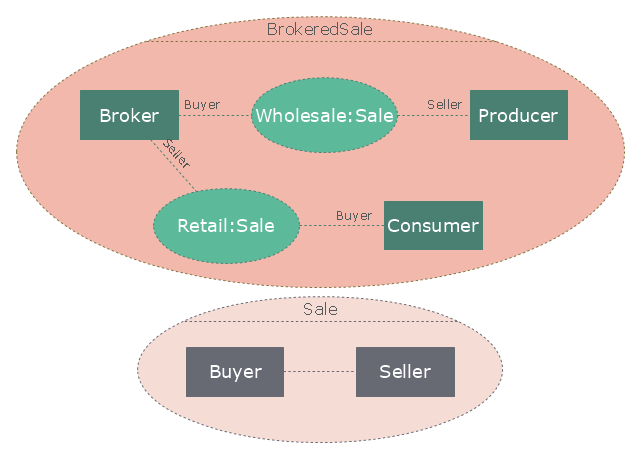
"A broker is an individual or party (brokerage firm) that arranges transactions between a buyer and a seller for a commission when the deal is executed. A broker who also acts as a seller or as a buyer becomes a principal party to the deal. Distinguish agent - one who acts on behalf of a principal. ...
In general a broker is an independent agent used extensively in some industries. A broker's prime responsibility is to bring sellers and buyers together and thus a broker is the third-person facilitator between a buyer and a seller. An example would be a real estate broker who facilitates the sale of a property.
Brokers also can furnish market information regarding prices, products, and market conditions. Brokers may represent either the seller (90% of the time) or the buyer (10%) but not both at the same time. An example would be a stockbroker, who makes the sale or purchase of securities on behalf of his client. Brokers play a huge role in the sale of stocks, bonds, and other financial services." [Broker. Wikipedia]
The UML composite structure diagram example "Sale process" was created using the ConceptDraw PRO diagramming and vector drawing software extended with the Rapid UML solution from the Software Development area of ConceptDraw Solution Park.
UML composite structure diagram
Marketing and Sales Organization chart. Organization chart Example

HelpDesk
How to Create a Sales Flowchart

 Sales Dashboard
Sales Dashboard solution extends ConceptDraw DIAGRAM software with templates, samples and library of vector stencils for drawing the visual dashboards of sale metrics and key performance indicators (KPI).
 Sales Flowcharts
The Sales Flowcharts solution lets you create and display sales process maps, sales process workflows, sales steps, the sales process, and anything else involving sales process management.
Root Cause Analysis


 Event-driven Process Chain Diagrams
Event-Driven Process Chain Diagrams solution extends ConceptDraw DIAGRAM functionality with event driven process chain templates, samples of EPC engineering and modeling the business processes, and a vector shape library for drawing the EPC diagrams and EPC flowcharts of any complexity. It is one of EPC IT solutions that assist the marketing experts, business specialists, engineers, educators and researchers in resources planning and improving the business processes using the EPC flowchart or EPC diagram. Use the EPC solutions tools to construct the chain of events and functions, to illustrate the structure of a business process control flow, to describe people and tasks for execution the business processes, to identify the inefficient businesses processes and measures required to make them efficient.
CORRECTIVE ACTIONS PLANNING. Involvement Matrix

PROBLEM ANALYSIS. Prioritization Matrix

Sales Growth. Bar Graphs Example

Sales Process
- Sales Diagram Examples
- Diagram Sale
- Root cause analysis tree diagram - Sale problem solution ...
- Sales Process Flowchart. Flowchart Examples | Sales Process ...
- Business Processes Diagram For Sale
- Process Of Sale Diagram Business
- Fishbone Diagrams | Sales KPI Dashboards | Fishbone Diagram ...
- UML composite structure diagram - Sale process | Uml Diagram For ...
- Diagram Sales Transaction
- Erd Diagram For Pos System For Sale Process
- Sales Process Flowchart. Flowchart Examples | Global Payment ...
- Sales Process Example Diagram
- Sales Problem
- Draw A Point Of Sale System Process Diagram
- Root cause analysis tree diagram - Sale problem solution ...
- Sales Order Workflow Diagram
- Sales Process Management | Definition TQM Diagram | Process ...
- Erd Diagram About Tickets For Sale
- Point Of Sale Process Flow Diagram
- Sequence Diagram For Sales Process