"Root cause analysis (RCA) is a method of problem solving that tries to identify the root causes of faults or problems. ...
RCA (in steps 3, 4 and 5) forms the most critical part of successful corrective action, because it directs the corrective action at the true root cause of the problem. Knowing the root cause is secondary to the goal of prevention, but without knowing the root cause, it is not possible to determine what an effective corrective action for the defined problem would be. ...
3. Ask "why" and identify the causes associated with each step in the sequence towards the defined problem or event. "Why" is taken to mean "What were the factors that directly resulted in the effect?"
4. Classify causes into causal factors that relate to an event in the sequence and root causes, that if eliminated, can be agreed to have interrupted that step of the sequence chain.
5. Identify all other harmful factors that have equal or better claim to be called "root causes." If there are multiple root causes, which is often the case, reveal those clearly for later optimum selection." [Root cause analysis. Wikipedia]
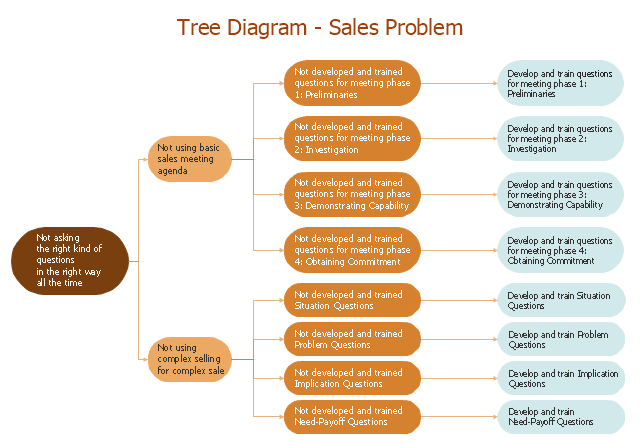
This root cause analysis (RCA) tree diagram example "Sale problem solution" was created using the ConceptDraw PRO diagramming and vector drawing software extended with the Seven Management and Planning Tools solution from the Management area of ConceptDraw Solution Park.
RCA (in steps 3, 4 and 5) forms the most critical part of successful corrective action, because it directs the corrective action at the true root cause of the problem. Knowing the root cause is secondary to the goal of prevention, but without knowing the root cause, it is not possible to determine what an effective corrective action for the defined problem would be. ...
3. Ask "why" and identify the causes associated with each step in the sequence towards the defined problem or event. "Why" is taken to mean "What were the factors that directly resulted in the effect?"
4. Classify causes into causal factors that relate to an event in the sequence and root causes, that if eliminated, can be agreed to have interrupted that step of the sequence chain.
5. Identify all other harmful factors that have equal or better claim to be called "root causes." If there are multiple root causes, which is often the case, reveal those clearly for later optimum selection." [Root cause analysis. Wikipedia]
This root cause analysis (RCA) tree diagram example "Sale problem solution" was created using the ConceptDraw PRO diagramming and vector drawing software extended with the Seven Management and Planning Tools solution from the Management area of ConceptDraw Solution Park.
RCA diagram
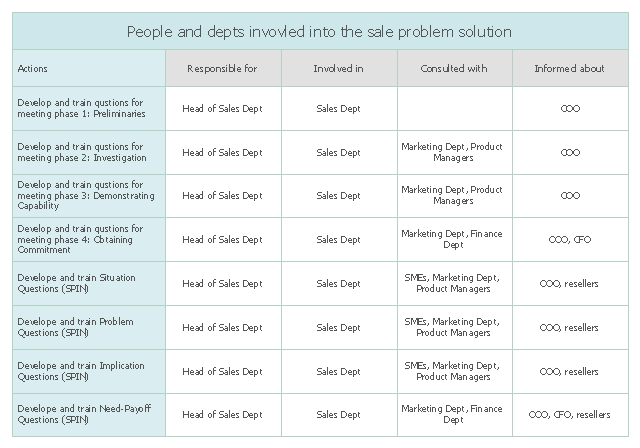
Key responsibility roles:
(1) Responsible.
Those who do the work to achieve the task. There is at least one role with a participation type of responsible, although others can be delegated to assist in the work required.
(2) Accountable (also approver or final approving authority).
The one ultimately answerable for the correct and thorough completion of the deliverable or task, and the one who delegates the work to those responsible. In other words, an accountable must sign off (approve) on work that responsible provides. There must be only one accountable specified for each task or deliverable.
(3) Consulted (sometimes counsel).
Those whose opinions are sought, typically subject matter experts; and with whom there is two-way communication.
(4) Informed.
Those who are kept up-to-date on progress, often only on completion of the task or deliverable; and with whom there is just one-way communication. [Responsibility assignment matrix. Wikipedia]
The involvement matrix example "Sale problem solution" was created using the ConceptDraw PRO diagramming and vector drawing software extended with the solution "Seven Management and Planning Tools" from the Management area of ConceptDraw Solution Park.
Involvement matrix
PERT Chart

Sales Process Flowchart Symbols

 Seven Management and Planning Tools
Seven Management and Planning Tools solution extends ConceptDraw PRO and ConceptDraw MINDMAP with features, templates, samples and libraries of vector stencils for drawing management mind maps and diagrams.
Using Fishbone Diagrams for Problem Solving

 Seven Management and Planning Tools
Seven Management and Planning Tools solution extends ConceptDraw PRO and ConceptDraw MINDMAP with features, templates, samples and libraries of vector stencils for drawing management mind maps and diagrams.
Affinity Diagram

Bar Chart Examples

Basic Flowchart Symbols and Meaning


Sales Process Map

Relations Diagram

Marketing and Sales Organization chart. Organization chart Example

Process Flowchart


- Sales Growth. Bar Graphs Example | Bar Diagrams for Problem ...
- Sales Growth. Bar Graphs Example | Bar Diagrams for Problem ...
- Root cause analysis tree diagram - Sale problem solution | UML ...
- PERT chart - Sale problem solution | Bar Diagrams for Problem ...
- Root cause analysis tree diagram - Sale problem solution | Seven ...
- PROBLEM ANALYSIS. Prioritization Matrix | Sales steps - Vector ...
- Root cause analysis tree diagram - Sale problem solution | Root ...
- Process Flowchart | Root cause analysis tree diagram - Sale ...
- PROBLEM ANALYSIS. Root Cause Analysis Tree Diagram | Root ...
- Root cause analysis tree diagram - Template | PROBLEM ...
- Sales Growth. Bar Graphs Example
- Block diagram - Selling technology patent process | Sales Process ...
- Sales Growth. Bar Graphs Example | Basic Diagramming | Bar ...
- PERT Chart | PERT chart - Sale problem solution | CORRECTIVE ...
- Sales Growth. Bar Graphs Example | Bar Diagrams for Problem ...
- Sales Growth. Bar Graphs Example | Bar Graph | Bar Diagrams for ...
- PROBLEM ANALYSIS. Prioritization Matrix | Root Cause Analysis ...
- Bar Graphs | Sales Growth. Bar Graphs Example | Bar Graph | Bar ...
- PERT chart - Sale problem solution | CORRECTIVE ACTIONS ...
- Sales Growth. Bar Graphs Example | Bar Graphs | Bar Chart ...