This pie chart sample shows the make up of the top one percent of United States wage earners, grouped by occupation. Data for this graph is sourced from the November 2010 report written by Jon Bakija, Adam Cole, and Bradley T. Heim titled "Jobs and Income Growth of Top Earners and the Causes of Changing Income Inequality: Evidence from U.S. Tax Return Data", column "2005" in table 2, titled "Percentage of primary taxpayers in top one percent of the distribution of income (excluding capital gains) that are in each occupation", on page 50.
This pie chart sample was redesigned from the Wikimedia Commons file: Percentage of the top 1% wage earners in the United States by occupation (pie chart).svg.
[commons.wikimedia.org/ wiki/ File:Percentage_ of_ the_ top_ 1%25_ wage_ earners_ in_ the_ United_ States_ by_ occupation_ (pie_ chart).svg]
This file is licensed under the Creative Commons Attribution-Share Alike 3.0 Unported license. [creativecommons.org/ licenses/ by-sa/ 3.0/ deed.en]
"The distribution of wealth is a comparison of the wealth of various members or groups in a society. It differs from the distribution of income in that it looks at the distribution of ownership of the assets in a society, rather than the current income of members of that society." [Distribution of wealth. Wikipedia]
The pie chart example "Percentage of the top 1% wage earners in the US by occupation" was created using the ConceptDraw PRO diagramming and vector drawing software extended with the Pie Charts solutiton of the Graphs and Charts area in ConceptDraw Solution Park.
 Basic Divided Bar Diagrams
This solution extends the capabilities of ConceptDraw PRO v10.3.0 (or later) with templates, samples and a library of vector stencils for drawing Divided Bar diagrams.
Bar Diagrams for Problem Solving. Create business management bar charts with Bar Graphs Solution
Create bar charts for business management problem solving and data comparison using the ConceptDraw PRO diagramming and vector drawing software extended with the Bar Graphs Solution from the Graphs and Charts area of ConceptDraw Solition Park.Bubble diagrams with ConceptDraw PRO
Using ConceptDraw you will be able to create bubble diagrams from the ready ConceptDraw library objects or make your own objects. The created diagram can be saved and edited, objects can be moved and links between them will be automatically repainted after object moving because of using the ConceptDraw connectors.Geo Map — USA — Wisconsin
Wisconsin is a U.S. state located in the north-central United States, in the Midwest and Great Lakes regions. The vector stencils library Wisconsin contains contours for ConceptDraw PRO diagramming and vector drawing software. This library is contained in the Continent Maps solution from Maps area of ConceptDraw Solution Park.
 Pie Charts
Pie Charts are extensively used in statistics and business for explaining data and work results, in mass media for comparison (i.e. to visualize the percentage for the parts of one total), and in many other fields. The Pie Charts solution for ConceptDraw PRO v10 offers powerful drawing tools, varied templates, samples, and a library of vector stencils for simple construction and design of Pie Charts, Donut Chart, and Pie Graph Worksheets.
Basic Flowchart Symbols and Meaning
Flowcharts are the best for visually representation the business processes and the flow of a custom-order process through various departments within an organization. ConceptDraw PRO diagramming and vector drawing software extended with Flowcharts solution offers the full set of predesigned basic flowchart symbols which are gathered at two libraries: Flowchart and Flowcharts Rapid Draw. Among them are: process, terminator, decision, data, document, display, manual loop, and many other specific symbols. The meaning for each symbol offered by ConceptDraw gives the presentation about their proposed use in professional Flowcharts for business and technical processes, software algorithms, well-developed structures of web sites, Workflow diagrams, Process flow diagram and correlation in developing on-line instructional projects or business process system. Use of ready flow chart symbols in diagrams is incredibly useful - you need simply drag desired from the libraries to your document and arrange them in required order. There are a few serious alternatives to Visio for Mac, one of them is ConceptDraw PRO. It is one of the main contender with the most similar features and capabilities.
Cross-Functional Process Map Template
When you need a drawing software to create a professional looking cross-functional charts, ConceptDraw with its Arrows10 Technology - is more than enough versatility to draw any type of diagram with any degree of complexity. Use templates with process maps, diagrams, charts to get the drawing in minutes.Geo Map of Americas
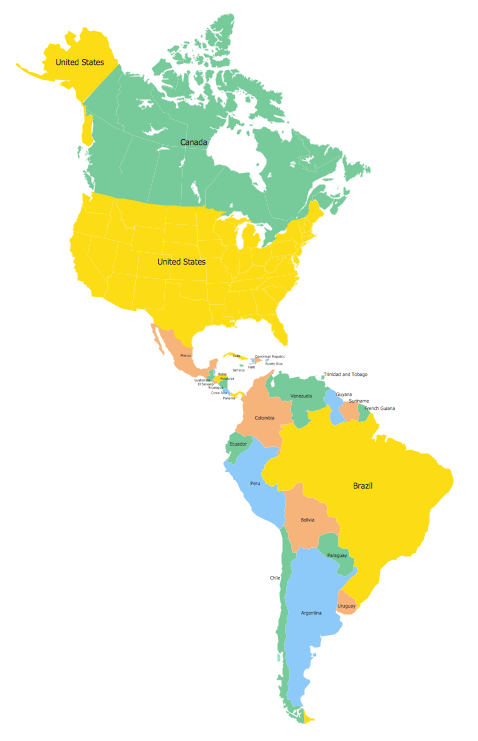
The Americas are the combined continental landmasses of North America and South America, in the Western Hemisphere. There are 35 sovereign states in the Americas. ConceptDraw is idea to draw the geological maps of America from the pre-designed vector geo map shapes and vector images map of america. Use Continent Maps solution from the Maps area of ConceptDraw Solution Park to draw thematic maps, geospatial infographics and vector illustrations for your business documents, presentations and websites.
 macOS User Interface
macOS User Interface solution extends the ConceptDraw PRO functionality with powerful GUI software graphic design features and tools. It provides an extensive range of multifarious macOS Sierra user interface design examples, samples and templates, and wide variety of libraries, containing a lot of pre-designed vector objects of Mac Apps icons, buttons, dialogs, menu bars, indicators, pointers, controls, toolbars, menus, and other elements for fast and simple designing high standard user interfaces of any complexity for new macOS Sierra.
Geo Map — United States of America Map
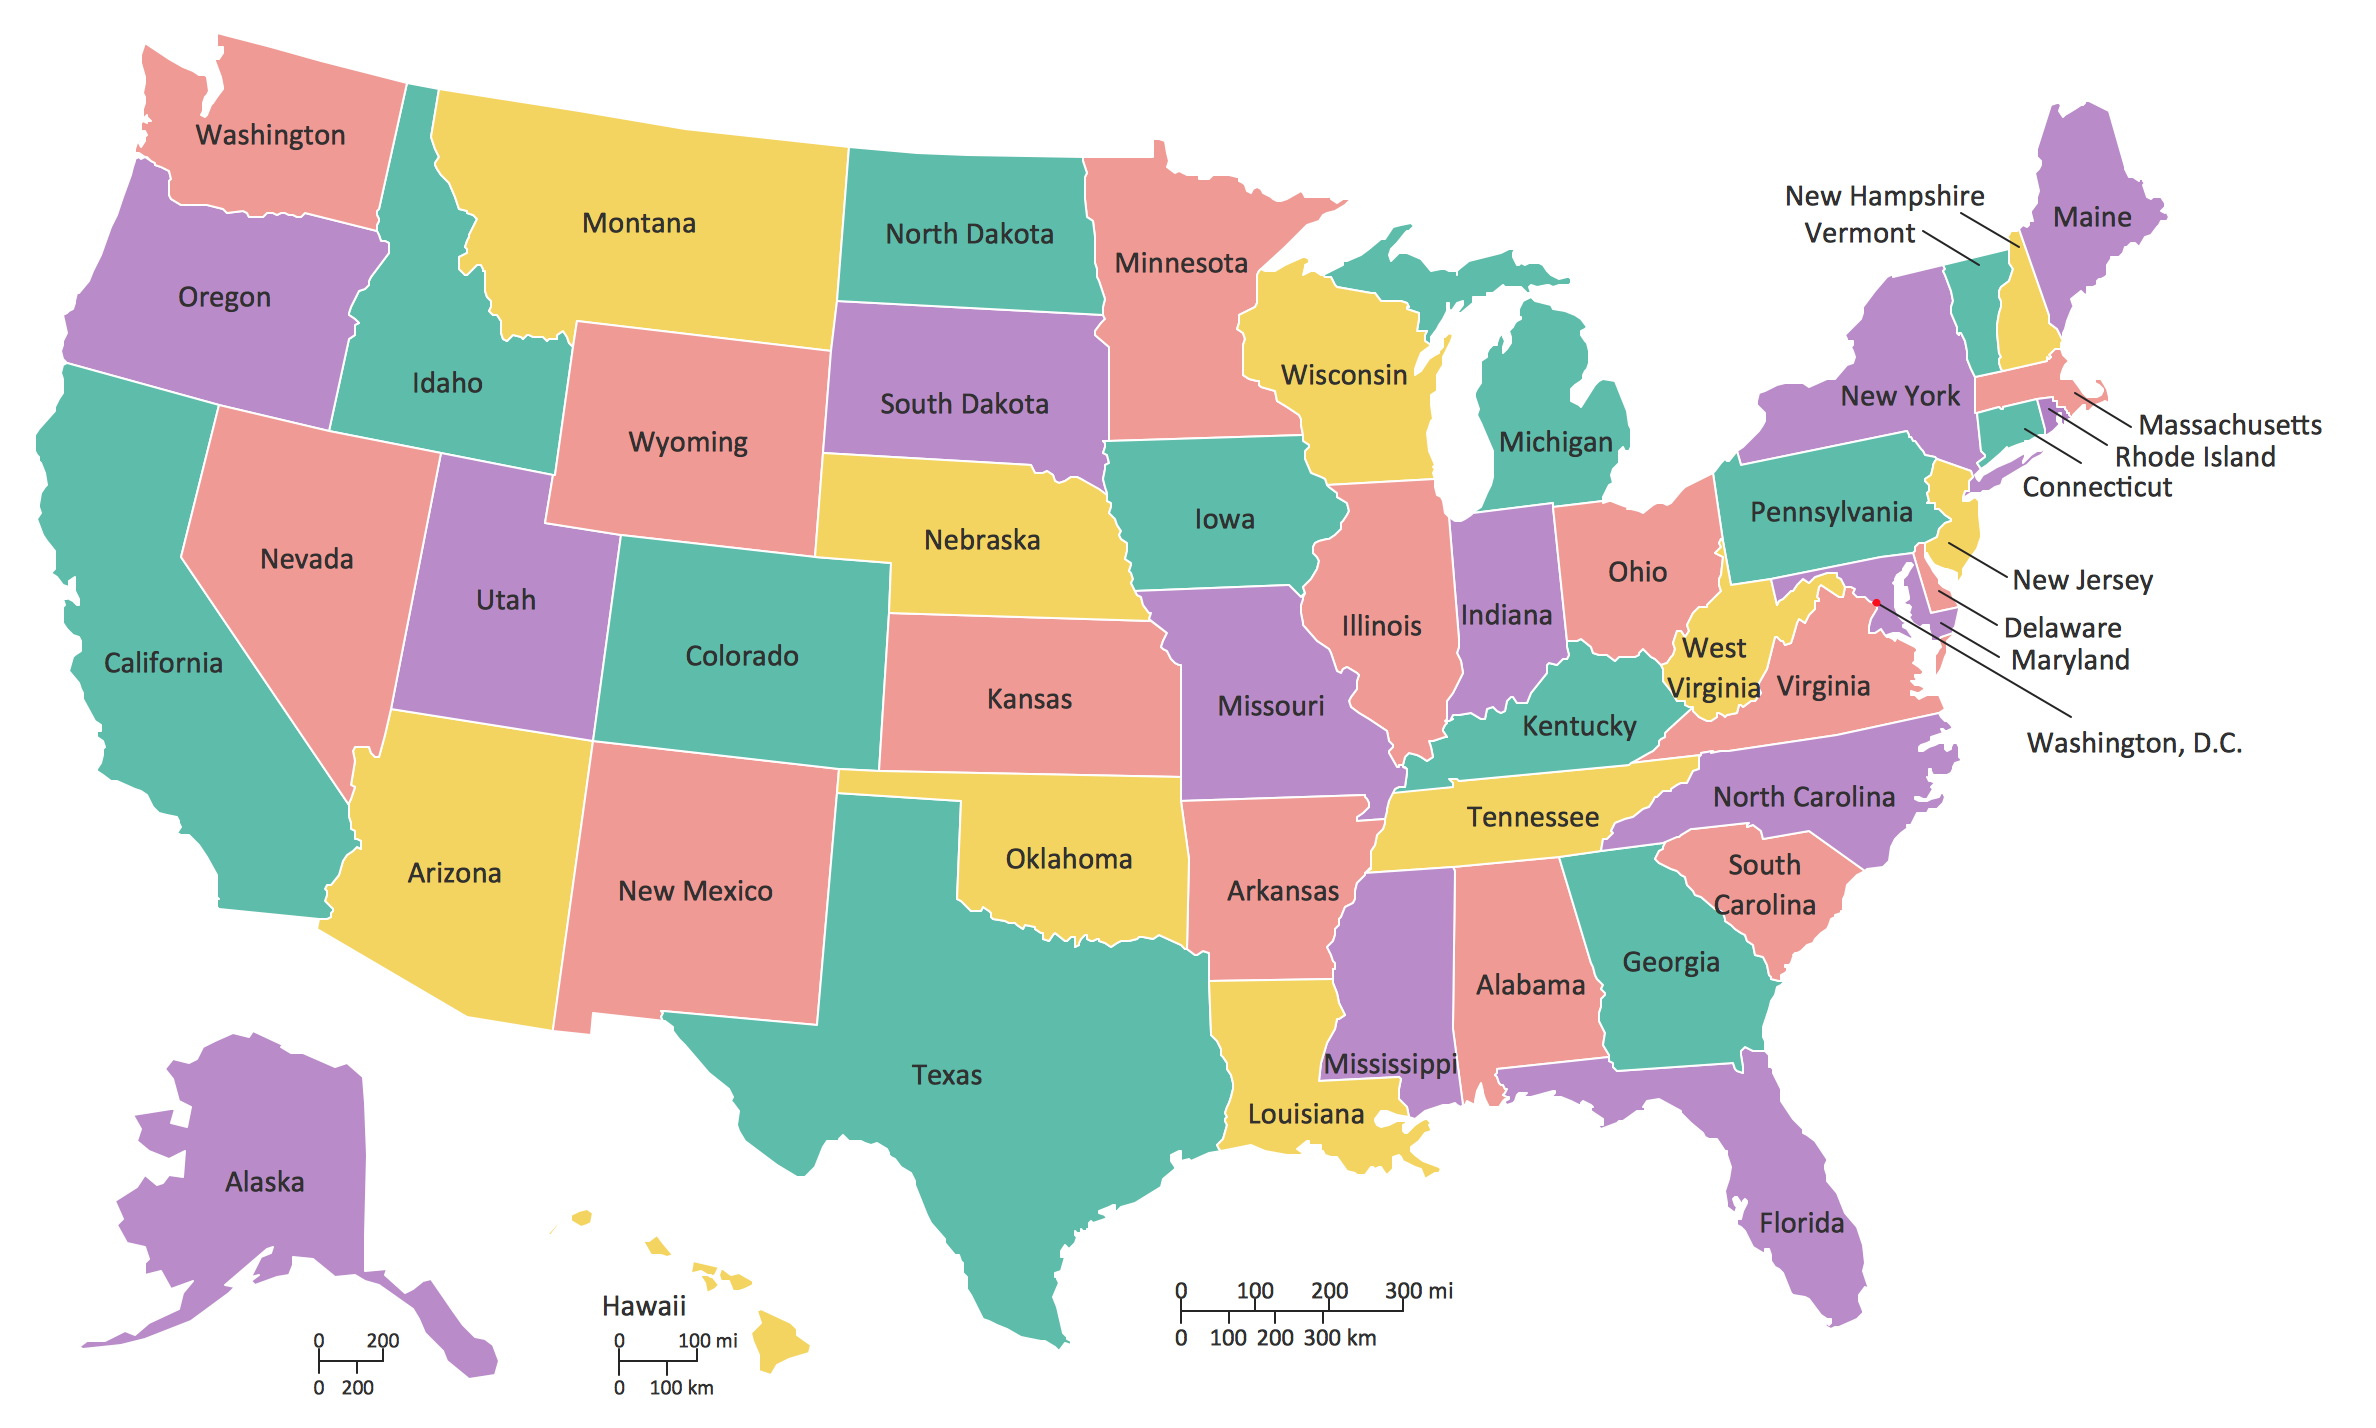
United States of America (USA) is a federal republic that includes 50 states and a federal district. It is the third largest country by population, fourth by the total area, and one of the most diverse in respect of nationalities and cultures. ConceptDraw PRO software extended with Continent Maps solution is ideal to draw professional looking Geological map of United States of America, USA map with states, the separate maps of different states of America, thematic maps, geospatial infographics, and varied vector illustrations for your business documents, presentations and websites. Use the pre-designed vector geo map shapes offered by numerous libraries, in particular by the United States of America library that contains 53 United States of America map contours. Each map is scaled, with the option to add the further levels of detail, thus the county borders, their names, capitals, and major cities can be instantly shown or hidden using the Action menu for each state map. ConceptDraw PRO software gives you a full control over the map size, shading, color fills and alignment.Scrum process work items and workflow
Teams working with Scrum methodology use the product backlog items (PBIs), bug work item types (WITs), reports and dashboards. SCRUM Workflow solution for ConceptDraw PRO software offers collection of samples, variety of predesigned objects, clipart and graphic elements, a set of Scrum process work items and workflow which are developed for agile teams working using Scrum.
 Language Learning
Language Learning solution extends ConceptDraw PRO software with templates, samples and library of vector stencils for drawing the sentence diagrams.
 Business Package for Management
Package intended for professional who designing and documenting business processes, preparing business reports, plan projects and manage projects, manage organizational changes, prepare operational instructions, supervising specific department of an organization, workout customer service processes and prepare trainings for customer service personal, carry out a variety of duties to organize business workflow.
 School and Training Plans
Planning a school and its campus layout needs to depict the premises, represent internal spaces, location of windows and direction of natural light. Detailed classroom seating chart helps you visualize location of the blackboard and desks, taking into account the specifics of the room and its lighting, with a goal to design the classroom to be comfortable for each pupil and teacher.
- Composition Dashboard | Comparison Dashboard | How to Connect ...
- Percentage Pie Chart. Pie Chart Examples | Percentage of the top 1 ...
- ConceptDraw PRO 9 Comparison with Omnigraffle Professional and ...
- Infographics Illustrating A Comparison Of The Event Rio 2016
- Business and Finance Illustrations | Business Productivity ...
- Support calls by products - Visual dashboard | Sales Dashboards for ...
- Time series charts - Vector stencils library | Comparison charts ...
- Export from ConceptDraw PRO Document to a Graphic File ...
- Business people - Vector stencils library | Bar Diagrams for Problem ...
- Export from ConceptDraw PRO Document to a Graphic File ...
- Presentation design elements - Vector clipart library | Collaboration ...
- Sales Dashboards for Your Company | Bar Graphs | Projects HR ...
- Pie Charts | Network Visualization with ConceptDraw PRO | HR ...
- Business People Clipart | Presentation design elements - Vector ...
- HR workflow - Vector stencils library | People pictograms - Vector ...
- Presentation design elements - Vector clipart library | Design ...
- Business people - Vector stencils library | Export from ConceptDraw ...
- HR workflow - Vector stencils library
- Compare Information Oriented Flow Chart And Process Oriented
- How to Draw the Different Types of Pie Charts | Pie Chart Software ...


