The vector stencils library "Time series charts" contains 10 templates of time series charts: 3 column charts, 3 bar charts, 2 line graphs and 2 dot plots. All these time series charts are Live Objects displaying the data from external data source files.
Use this library to create your visual dashboards in the ConceptDraw PRO diagramming and vector drawing software extended with the Time Series Dashboard solution from the area "What is a Dashboard" of ConceptDraw Solution Park.
Use this library to create your visual dashboards in the ConceptDraw PRO diagramming and vector drawing software extended with the Time Series Dashboard solution from the area "What is a Dashboard" of ConceptDraw Solution Park.
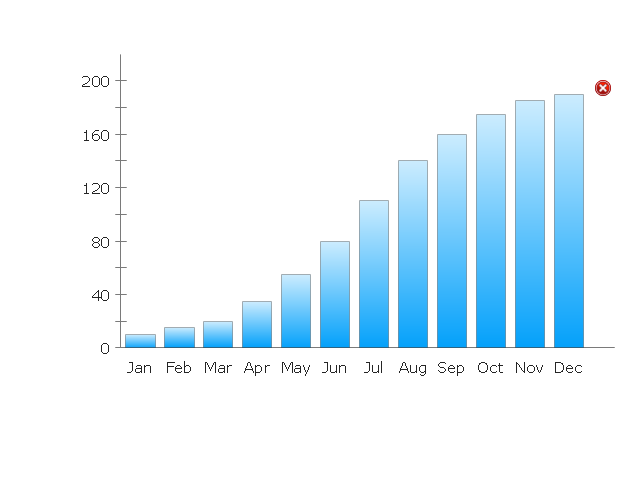
Column Chart 1
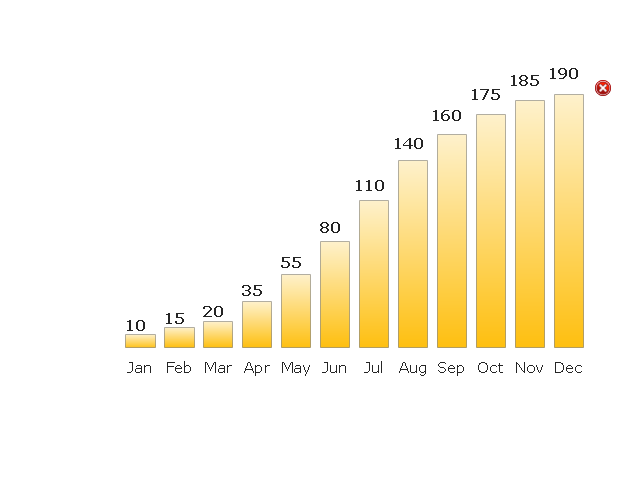
Column Chart 2
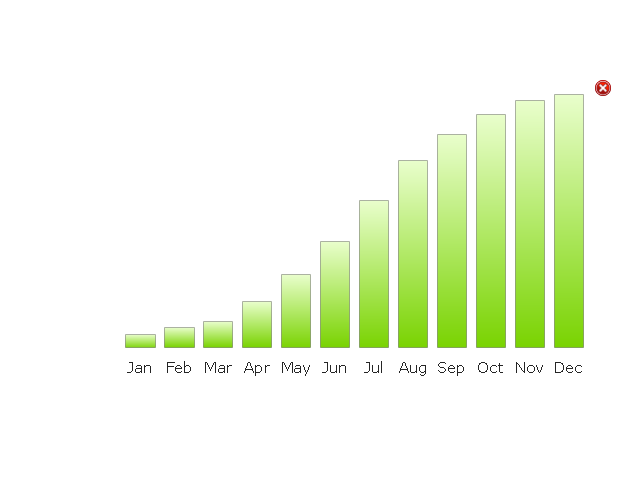
Column Chart 3
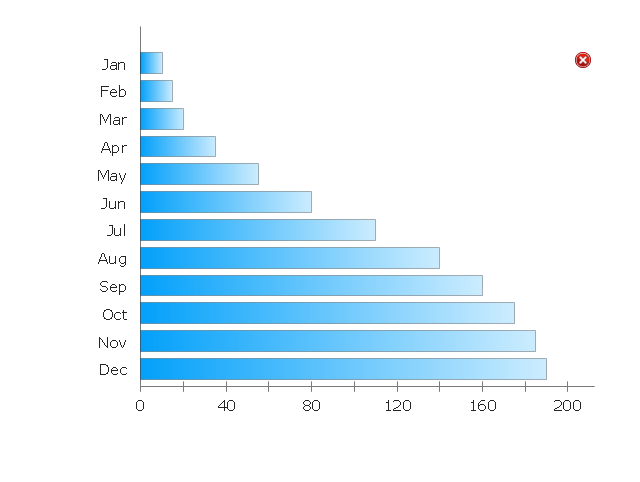
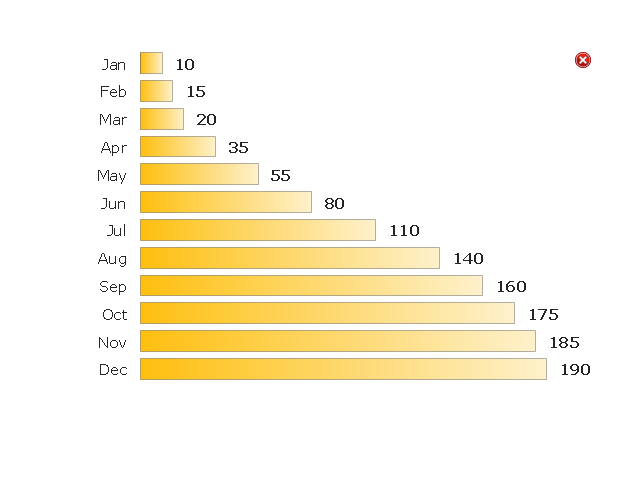
Bar Chart 1
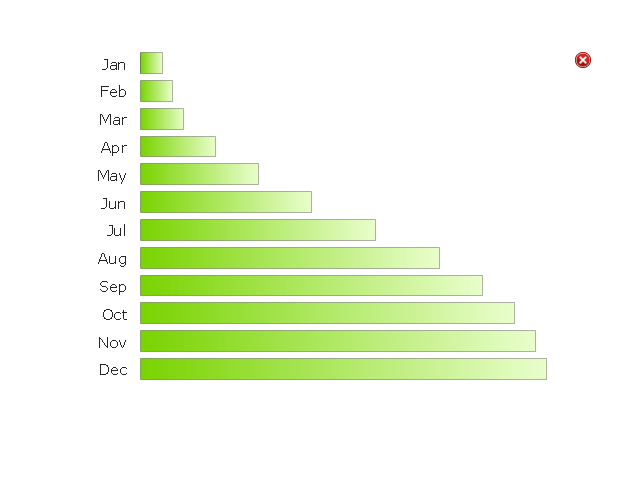
Bar Chart 2
Bar Chart 3
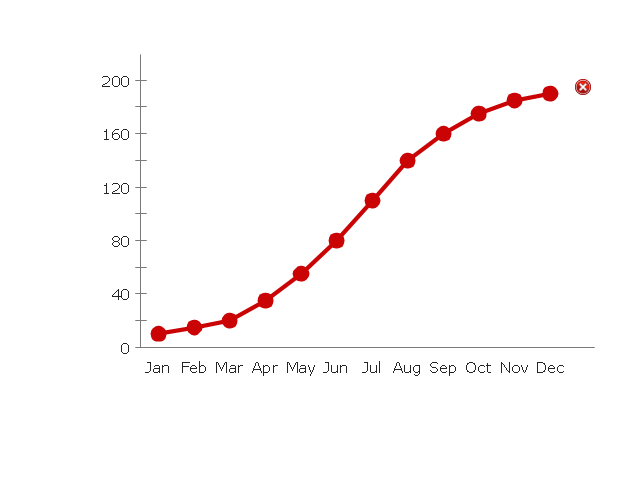
Line Chart 1
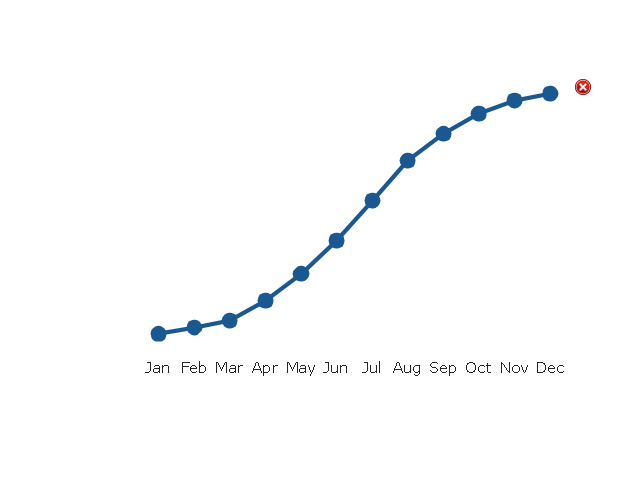
Line Chart 2
Dot Plot 1
Dot Plot 2
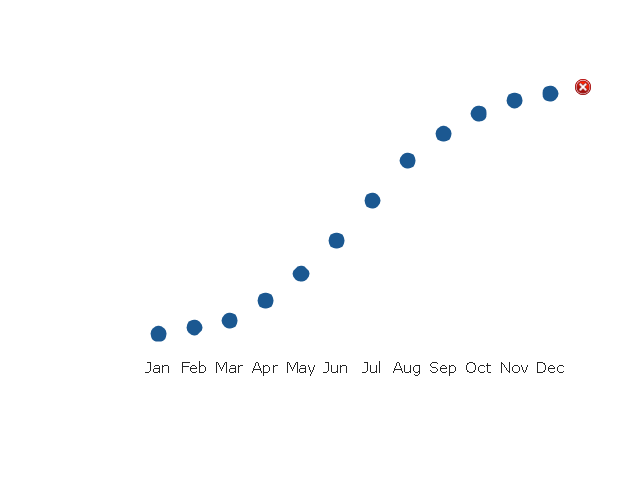
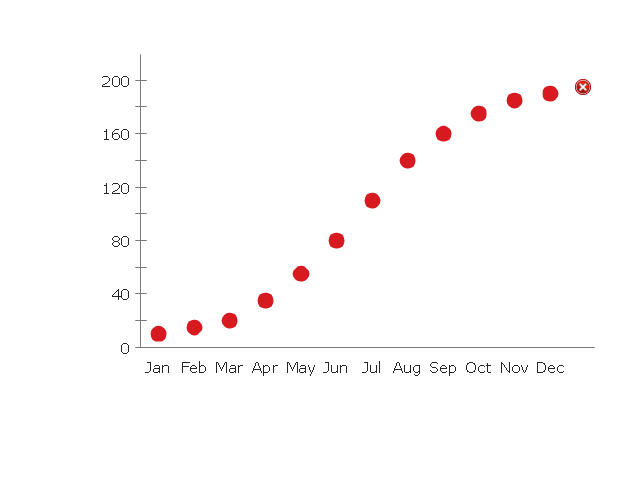
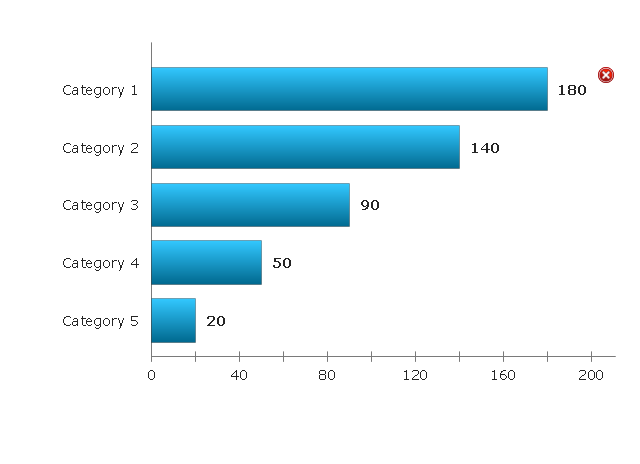
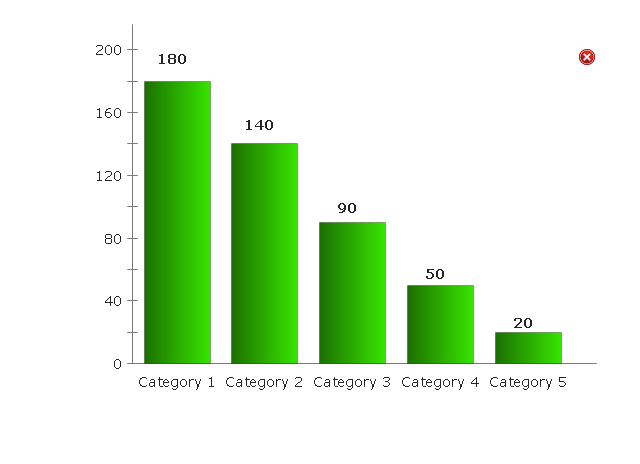
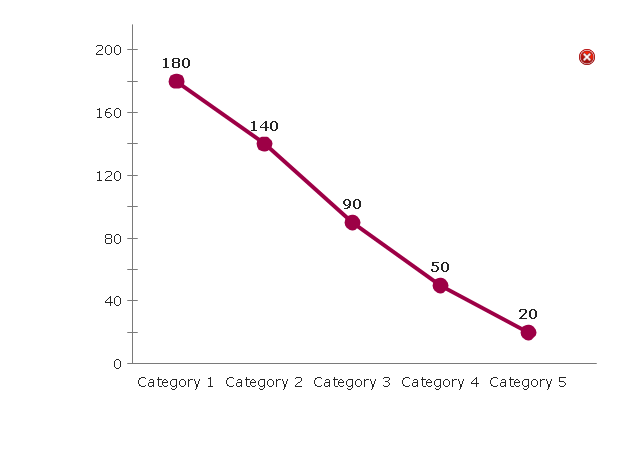
The vector stencils library "Comparison charts" contains 4 Live Objects: Horizontal bar chart template, Column chart (Vertical bar chart) template, Line chart template and Dot plot (Scatter chart) template.
Use it for drawing visual dashboards in the ConceptDraw PRO diagramming and vector drawing software extended with the Comparison Dashboard solution from the area "What is a Dashboard" of ConceptDraw Solution Park.
www.conceptdraw.com/ solution-park/ comparison-dashboard
Use it for drawing visual dashboards in the ConceptDraw PRO diagramming and vector drawing software extended with the Comparison Dashboard solution from the area "What is a Dashboard" of ConceptDraw Solution Park.
www.conceptdraw.com/ solution-park/ comparison-dashboard
Horizontal Bar Chart
Column Chart
Line Chart
Dot Plot
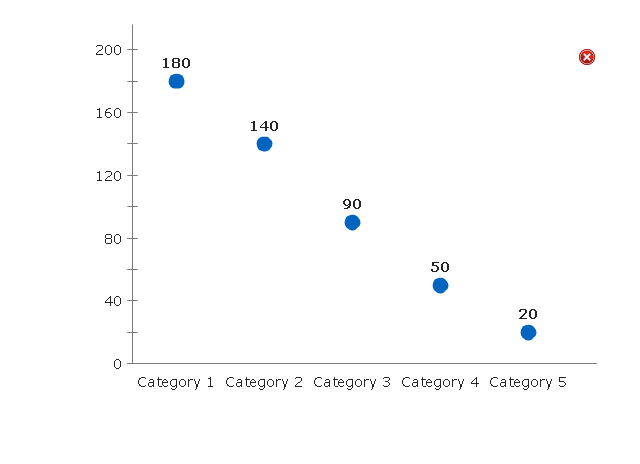
Chart Maker for Presentations

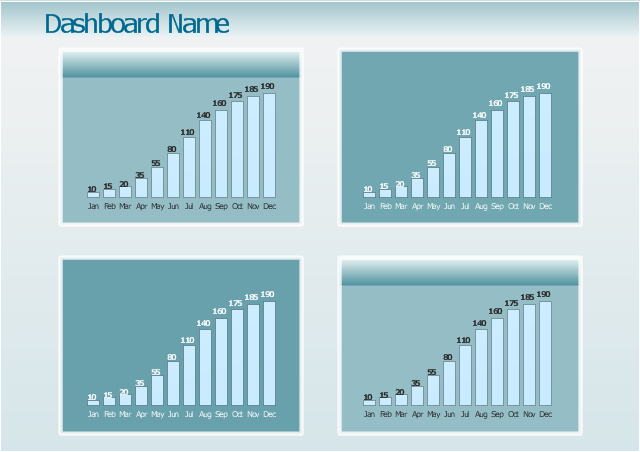
This dashboard template consist of 4 column charts. All these column charts are Live Objects displaying the data from the external source files. Use it to create your business performance management dashboard showing 4 time series of your metrics.
The business performance dashboard template "Time series digital dashboard" for the ConceptDraw PRO diagramming and vector drawing software is included in the Time Series Dashboard solution from the area "What is a Dashboard" of ConceptDraw Solution Park.
The business performance dashboard template "Time series digital dashboard" for the ConceptDraw PRO diagramming and vector drawing software is included in the Time Series Dashboard solution from the area "What is a Dashboard" of ConceptDraw Solution Park.
Time series digital dashboard - Template
This projects HR dashboard example includes the histogram of employees distribution by salary, the area chart of salari distribution, and two horizontal bar charts: "Employees by Project Teams" and "Payroll Breakdown".
"Project Portfolio Management (PPM) is the centralized management of processes, methods, and technologies used by project managers and project management offices (PMOs) to analyze and collectively manage a group of current or proposed projects based on numerous key characteristics. The objectives of PPM are to determine the optimal resource mix for delivery and to schedule activities to best achieve an organization’s operational and financial goals ― while honouring constraints imposed by customers, strategic objectives, or external real-world factors. ... With PPM, the Office of Finance can improve their accuracy for estimating and managing the financial resources of a project or group of projects. In addition, the value of projects can be demonstrated in relation to the strategic objectives and priorities of the organization through financial controls and to assess progress through earned value and other project financial techniques." [Project portfolio management. Wikipedia]
The example "Projects HR dashboard" was created using the ConceptDraw PRO diagramming and vector drawing software extended with the Frequency Distribution Dashboard solution from the area "What is a Dashboard" of ConceptDraw Solution Park.
Visual dashboard

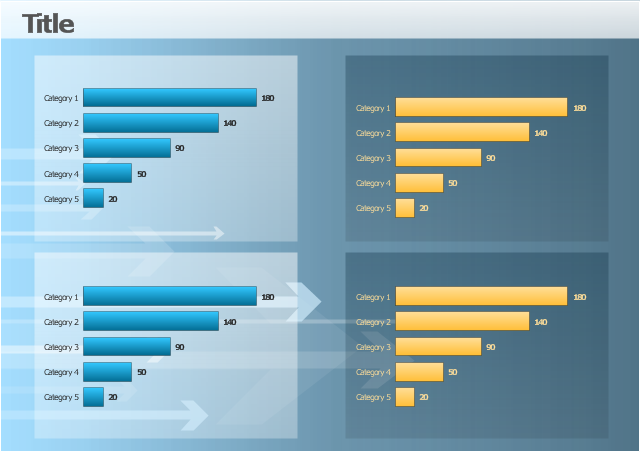
The template "Comparison dashboard" for the ConceptDraw PRO diagramming and vector drawing software is included in the Comparison Dashboard solution from the area "What is a Dashboard" of ConceptDraw Solution Park.
Visual dashboard template
Bar Chart Examples

Bar Chart Software

Pie Graph Worksheets

Line Chart Examples

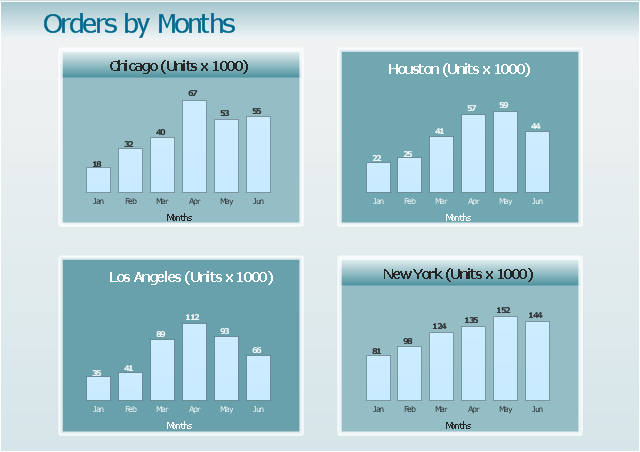
"A time series is a sequence of data points, measured typically at successive points in time spaced at uniform time intervals. ... Time series are very frequently plotted via line charts. Time series are used in statistics, signal processing, pattern recognition, econometrics, mathematical finance, weather forecasting, earthquake prediction, electroencephalography, control engineering, astronomy, and communications engineering.
Time series analysis comprises methods for analyzing time series data in order to extract meaningful statistics and other characteristics of the data. Time series forecasting is the use of a model to predict future values based on previously observed values." [Time series. Wikipedia]
The example "Orders by months - Time series dashboard" was created using the ConceptDraw PRO diagramming and vector drawing software extended with the Time Series Dashboard solution from the area "What is a Dashboard" of ConceptDraw Solution Park.
Order by months - Time series dashboard
Column Chart Examples

Column Chart Template

Bar Chart Template for Word

Rainfall Bar Chart

- Bar Chart Examples | Rainfall Bar Chart | Chart Maker for ...
- Defination Of Graphics Pie Chart Bar Chart Table Flow Chart
- Composition Conversion Of Graphics Pie Chart Bar Chart Table
- Polar Graph | Components of ER Diagram | Draw Fishbone Diagram ...
- Examples of Flowcharts, Org Charts and More | Business Report Pie ...
- Bar Chart Examples | How to Create a Bar Chart | Bar charts - Vector ...
- Bar Graphs | Sales Growth. Bar Graphs Example | Picture Graphs ...
- Comparison charts - Vector stencils library | Time series charts ...
- Time series charts - Vector stencils library | Design elements - Time ...
- Barchart Natural Gas
- Time series charts - Vector stencils library | Bar Chart Template for ...
- Bar Chart Template for Word | Bar Chart Examples | Rainfall Bar ...
- Changes in price indices - Double bar chart | Bar Chart Examples ...
- Bar Graphs | Ice Hockey Rink Dimensions | Bar Graph | Blue Bar ...
- Blue Bar Graph Png
- Line Chart Template for Word | Line Graph Charting Software | Line ...
- Line Chart Examples | Line Chart Templates | Time series charts ...
- Bar Diagrams for Problem Solving. Create business management ...
- Bar Graphs | Process Flowchart | Bar Diagrams for Problem Solving ...
- Bar Chart Template for Word | Chart Maker for Presentations | How ...