Column Chart Examples

Column Chart Template

How to Create a Column Chart

Column Chart Software

Sales Growth. Bar Graphs Example

Chart Examples

Bar Chart Template for Word

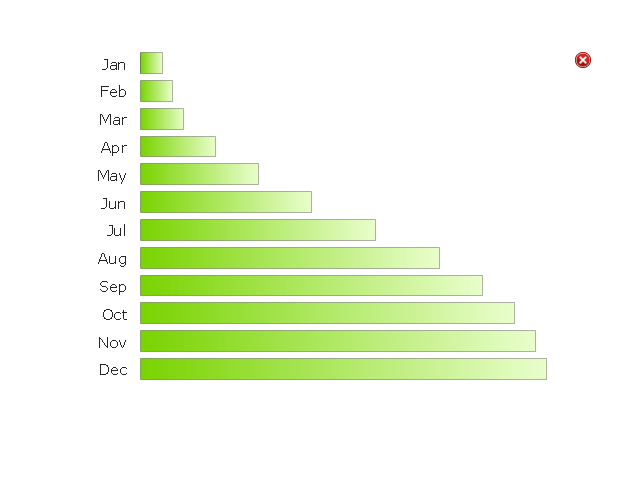
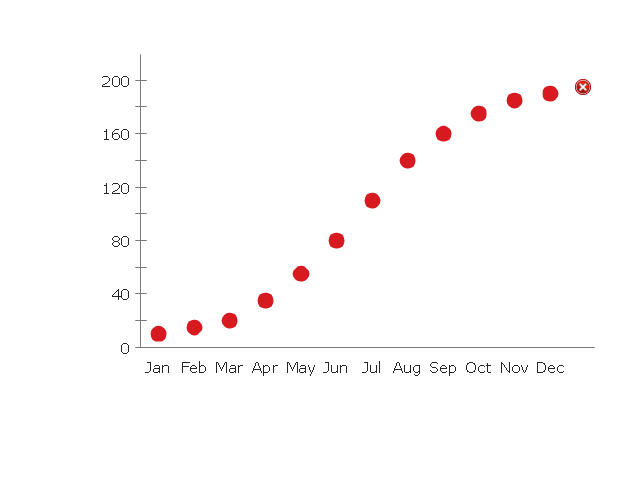
The vector stencils library "Time series charts" contains 10 templates of time series charts: 3 column charts, 3 bar charts, 2 line graphs and 2 dot plots. All these time series charts are Live Objects displaying the data from external data source files.
Use this library to create your visual dashboards in the ConceptDraw PRO diagramming and vector drawing software extended with the Time Series Dashboard solution from the area "What is a Dashboard" of ConceptDraw Solution Park.
Use this library to create your visual dashboards in the ConceptDraw PRO diagramming and vector drawing software extended with the Time Series Dashboard solution from the area "What is a Dashboard" of ConceptDraw Solution Park.
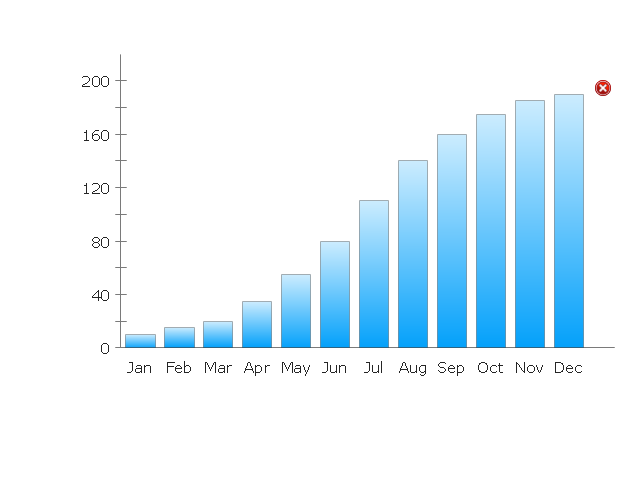
Column Chart 1
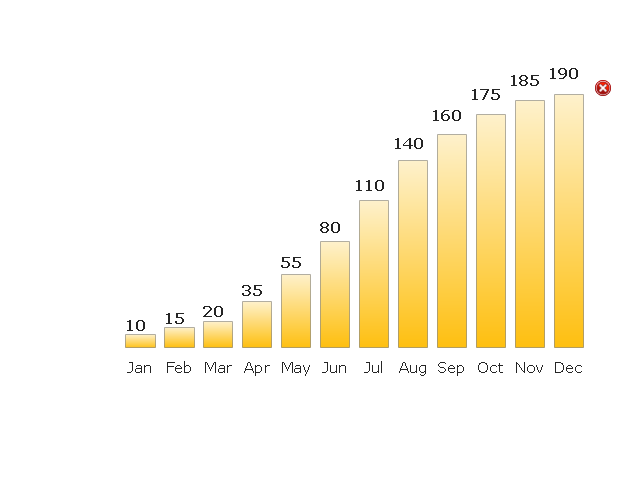
Column Chart 2
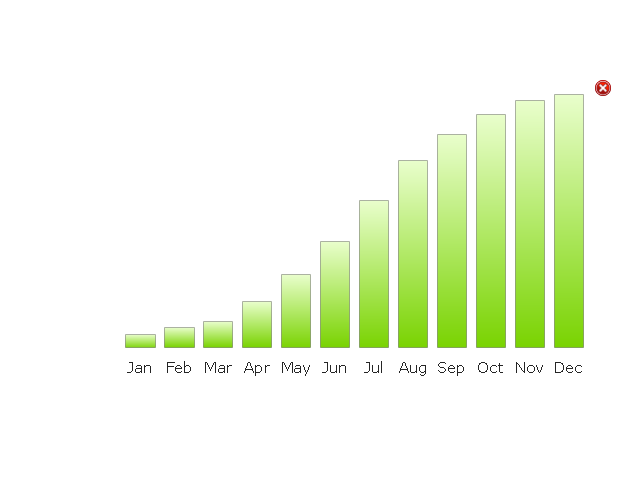
Column Chart 3
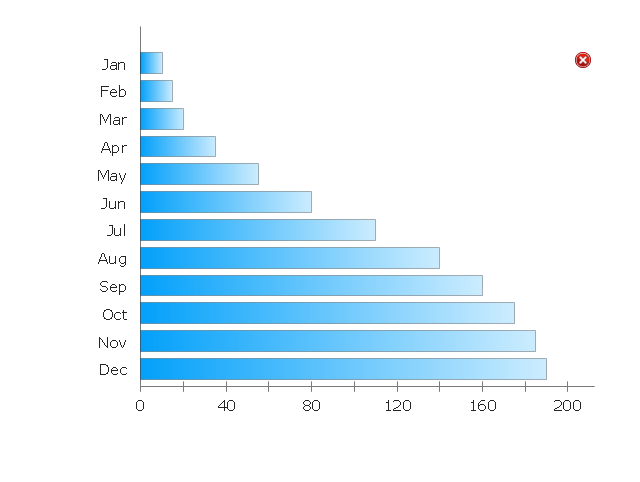
Bar Chart 1
Bar Chart 2
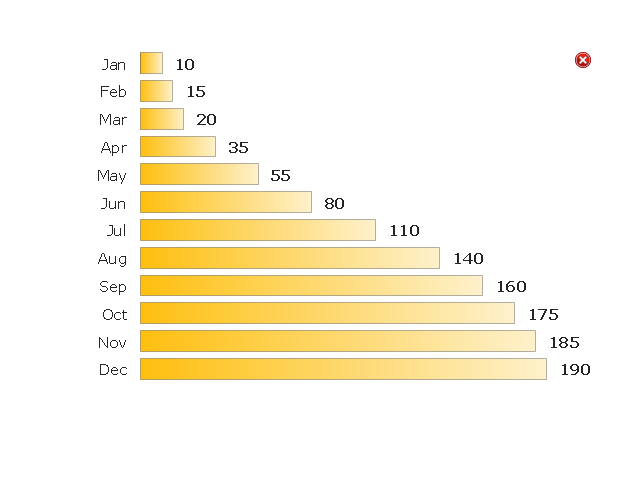
Bar Chart 3
Line Chart 1
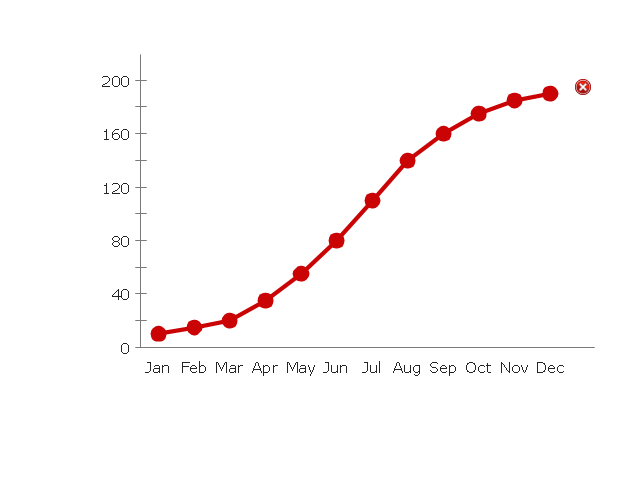
Line Chart 2
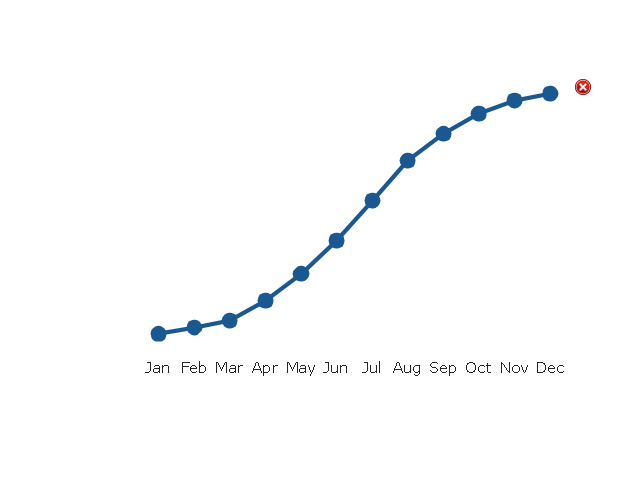
Dot Plot 1
Dot Plot 2
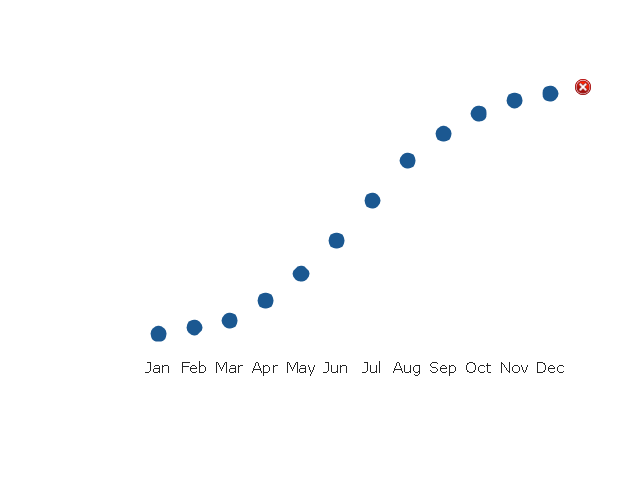
The vector stencils library "Time series charts" contains 10 templates of time series charts: 3 column charts, 3 bar charts, 2 line graphs and 2 dot plots. All these time series charts are Live Objects displaying the data from external data source files.
Use this library to create your visual dashboards in the ConceptDraw PRO diagramming and vector drawing software extended with the Time Series Dashboard solution from the area "What is a Dashboard" of ConceptDraw Solution Park.
Use this library to create your visual dashboards in the ConceptDraw PRO diagramming and vector drawing software extended with the Time Series Dashboard solution from the area "What is a Dashboard" of ConceptDraw Solution Park.
Column Chart 1
Column Chart 2
Column Chart 3
Bar Chart 1
Bar Chart 2
Bar Chart 3
Line Chart 1
Line Chart 2
Dot Plot 1
Dot Plot 2
Financial Comparison Chart

- Time series charts - Vector stencils library
- Basic Pie Charts | Flowchart Components | Column Chart Template ...
- Chart Maker for Presentations | Serious crime in Cincinnati | Column ...
- Bar Chart Software | Bar Chart Examples | Column Chart Software ...
- How To Create a Flow Chart in ConceptDraw | Human Resource ...
- How to Draw a Divided Bar Chart in ConceptDraw PRO | Divided ...
- Bar chart - Template | Bar Chart Examples | Bar Chart Software ...
- Geo Map - Asia - Papua New Guinea | Basic Bar Graphs | 3D ...
- Pie charts - Vector stencils library | Data-driven charts - Vector ...
- Pyramid Diagram and Pyramid Chart | Pyramid Diagram | Pyramid ...