"A price index (plural: “price indices” or “price indexes”) is a normalized average (typically a weighted average) of price relatives for a given class of goods or services in a given region, during a given interval of time. It is a statistic designed to help to compare how these price relatives, taken as a whole, differ between time periods or geographical locations.
Price indexes have several potential uses. For particularly broad indices, the index can be said to measure the economy's general price level or a cost of living. More narrow price indices can help producers with business plans and pricing. Sometimes, they can be useful in helping to guide investment." [Price index. Wikipedia]
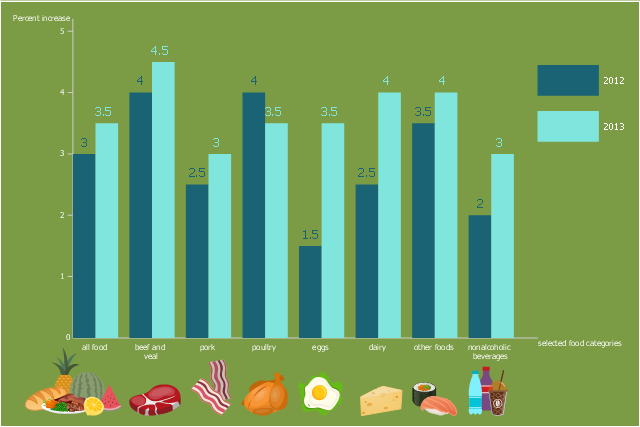
The double bar chart example "Changes in price indices" was redrawn from the website of the United States Department of Agriculture Economic Research Service. [ers.usda.gov/ data-products/ chart-gallery/ detail.aspx?chartId=29456&ref=collection#.Ue5MMaxad5I]
The double bar chart example "Changes in price indices" was created using the ConceptDraw PRO diagramming and vector drawing software extended with the Bar Graphs solution from the Graphs and Charts area of ConceptDraw Solution Park.
Price indexes have several potential uses. For particularly broad indices, the index can be said to measure the economy's general price level or a cost of living. More narrow price indices can help producers with business plans and pricing. Sometimes, they can be useful in helping to guide investment." [Price index. Wikipedia]
The double bar chart example "Changes in price indices" was redrawn from the website of the United States Department of Agriculture Economic Research Service. [ers.usda.gov/ data-products/ chart-gallery/ detail.aspx?chartId=29456&ref=collection#.Ue5MMaxad5I]
The double bar chart example "Changes in price indices" was created using the ConceptDraw PRO diagramming and vector drawing software extended with the Bar Graphs solution from the Graphs and Charts area of ConceptDraw Solution Park.
Double bar graph
Bar Chart Examples

Column Chart Software

 Bar Graphs
The Bar Graphs solution enhances ConceptDraw PRO v10 functionality with templates, numerous professional-looking samples, and a library of vector stencils for drawing different types of Bar Graphs, such as Simple Bar Graph, Double Bar Graph, Divided Bar Graph, Horizontal Bar Graph, Vertical Bar Graph, and Column Bar Chart.
Sales Growth. Bar Graphs Example

Scatter Graph

Bar Graph

Chart Examples

Bar Diagrams for Problem Solving. Create manufacturing and economics bar charts with Bar Graphs Solution

Column Chart Template

Chart Templates

Bar Diagrams for Problem Solving. Create business management bar charts with Bar Graphs Solution

Bar Chart Software

Bar Diagrams for Problem Solving. Create space science bar charts with Bar Graphs Solution

Create bar graphs for visual solving your scientific problems and data comparison using the ConceptDraw PRO diagramming and vector drawing software extended with the Bar Graphs Solution from the Graphs and Charts area of ConceptDraw Solition Park.
Scatter Plot

- Double bar graph - Template
- Double Bar Graph Software
- Double bar chart - Changes in price indices | How to Create a Bar ...
- Bar Graphs | Sales Growth. Bar Graphs Example | How to Create a ...
- Changes in price indices - Double bar chart | Double Bar Diagram In ...
- Bar Graphs | Nitrate concentration in Community Water Systems ...
- Bar Graph Use For Economy
- Bar Chart Software | Bar Chart Examples | How to Create a Bar ...
- Conceptdraw Price
- Bar Chart Examples | Sales Growth. Bar Graphs Example | Financial ...
- Global natural gas consumption (2010) - Divided bar graph | Divided ...
- Fast food restaurant menu prices | Food Pictures | How To Create ...
- Bar Graphs
- Example Of Bar Chart About The Economy
- Bar Diagram In Economy
- How to Create a Bar Chart in ConceptDraw PRO | Bar Diagrams for ...
- Sales Growth. Bar Graphs Example | Bar Graph | Chart Maker for ...
- Bar Diagrams for Problem Solving. Create space science bar charts ...
- Bar Chart Examples | Bar Chart Template for Word | How to Create a ...
- Create A Divided Bar Graph