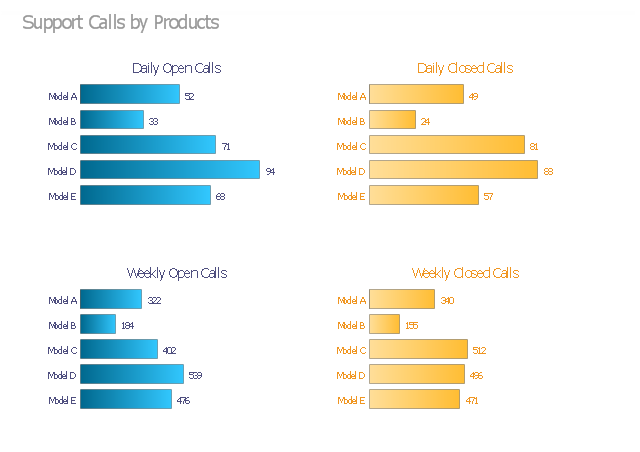
The visual dashboard example "Support calls by products" contains 4 horizontal bar charts used for the comparison of support calls data by products.
"Dashboards often provide at-a-glance views of KPIs (key performance indicators) relevant to a particular objective or business process (e.g. sales, marketing, human resources, or production). ... Dashboards give signs about a business letting the user know something is wrong or something is right. The corporate world has tried for years to come up with a solution that would tell them if their business needed maintenance or if the temperature of their business was running above normal. Dashboards typically are limited to show summaries, key trends, comparisons, and exceptions." [Dashboard (business). Wikipedia]
The business dashboard example "Support calls by products" was created using the ConceptDraw PRO diagramming and vector drawing software extended with the Comparison Dashboard solution from the area "What is a Dashboard" of ConceptDraw Solution Park.
Visual dashboard
Sales Dashboards for Your Company

 Bar Graphs
The Bar Graphs solution enhances ConceptDraw PRO v10 functionality with templates, numerous professional-looking samples, and a library of vector stencils for drawing different types of Bar Graphs, such as Simple Bar Graph, Double Bar Graph, Divided Bar Graph, Horizontal Bar Graph, Vertical Bar Graph, and Column Bar Chart.
This projects HR dashboard example includes the histogram of employees distribution by salary, the area chart of salari distribution, and two horizontal bar charts: "Employees by Project Teams" and "Payroll Breakdown".
"Project Portfolio Management (PPM) is the centralized management of processes, methods, and technologies used by project managers and project management offices (PMOs) to analyze and collectively manage a group of current or proposed projects based on numerous key characteristics. The objectives of PPM are to determine the optimal resource mix for delivery and to schedule activities to best achieve an organization’s operational and financial goals ― while honouring constraints imposed by customers, strategic objectives, or external real-world factors. ... With PPM, the Office of Finance can improve their accuracy for estimating and managing the financial resources of a project or group of projects. In addition, the value of projects can be demonstrated in relation to the strategic objectives and priorities of the organization through financial controls and to assess progress through earned value and other project financial techniques." [Project portfolio management. Wikipedia]
The example "Projects HR dashboard" was created using the ConceptDraw PRO diagramming and vector drawing software extended with the Frequency Distribution Dashboard solution from the area "What is a Dashboard" of ConceptDraw Solution Park.
Visual dashboard

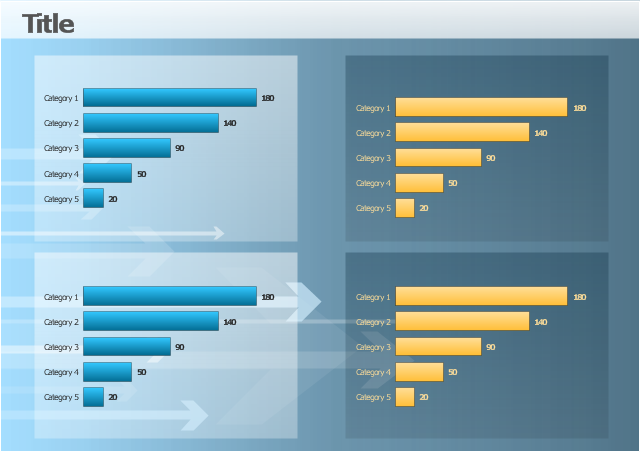
The template "Comparison dashboard" for the ConceptDraw PRO diagramming and vector drawing software is included in the Comparison Dashboard solution from the area "What is a Dashboard" of ConceptDraw Solution Park.
Visual dashboard template
 Basic Bar Graphs
This solution enhances ConceptDraw PRO v10.3.0 (or later) with templates, samples and a library of vector stencils for drawing Bar Graphs.
 Sales Dashboard
Sales Dashboard solution extends ConceptDraw PRO software with templates, samples and library of vector stencils for drawing the visual dashboards of sale metrics and key performance indicators (KPI).
 What is a Dashboard Area
Solutions from the area What is a Dashboard of ConceptDraw Solution Park collects templates, samples and vector stencils libraries with of data driven charts and indicators for drawing the basic types of Visual Dashboards.
 Composition Dashboard
Composition dashboard solution extends ConceptDraw PRO software with templates, samples and vector stencils library with charts and indicators for drawing visual dashboards showing data composition.
 Comparison Dashboard
Comparison dashboard solution extends ConceptDraw PRO software with samples, templates and vector stencils library with charts and indicators for drawing the visual dashboard comparing data.
 Meter Dashboard
Meter dashboard solution extends ConceptDraw PRO software with templates, samples and vector stencils library with meter indicators for drawing visual dashboards showing quantitative data.
 Time Series Dashboard
Time series dashboard solution extends ConceptDraw PRO software with templates, samples and vector stencils libraries with charts, graphs and plots for drawing the visual dashboards showing data time series.
 Frequency Distribution Dashboard
Frequency distribution dashboard solution extends ConceptDraw PRO software with samples, templates and vector stencils libraries with histograms and area charts for drawing the visual dashboards showing frequency distribution of data.
 ConceptDraw Dashboard for Facebook
ConceptDraw Dashboard for Facebook solution extends ConceptDraw PRO software with a dynamically updated visual dashboard, which shows lifetime total likes, daily friends of fans, and daily page views, information you can receive from Facebook Insights.
 Spatial Dashboard
Spatial dashboard solution extends ConceptDraw PRO software with templates, samples and vector stencils libraries with thematic maps for drawing visual dashboards showing spatial data.
- Divided Bar Diagrams | Bar Graphs | What is a Dashboard Area ...
- Sales Growth. Bar Graphs Example | Sales Dashboards for Your ...
- Sales Growth. Bar Graphs Example | Bar Chart Examples | Column ...
- Line Chart Examples | Bar Graphs | Sales Dashboard | Sales Bar ...
- Sales Growth. Bar Graphs Example | Sales Dashboard ...
- Sales Growth. Bar Graphs Example | Sales Dashboard | Line Chart ...
- Bar Graph | Design elements - Marketing charts | Composition ...
- Bar Graphs | Divided Bar Diagrams | What is a Dashboard Area ...
- Divided Bar Diagrams | Bar Graphs | Bar Chart Template for Word ...
- Bar Chart Examples
- Design elements - Composition charts and indicators | Bargraph ...
- Bar Graph | Double bar graph - Template | Divided Bar Diagrams ...
- Flowcharts | IDEF0 Diagrams | Explain Product Life Cycle Bar Graph
- Basic Diagramming | Bar Graph | Best Diagramming Software for ...
- Sales Growth. Bar Graphs Example
- Sales Growth. Bar Graphs Example | Bar Chart Examples | Bar ...
- What Do The Bars On This Bar Graph Represent
- Sales Growth. Bar Graphs Example
- Employee distribution - HR dashboard | Projects HR dashboard ...
- Composition Dashboard Solution. ConceptDraw.com | Picture ...