This site uses cookies. By continuing to browse the ConceptDraw site you are agreeing to our Use of Site Cookies.
HelpDesk

How To Create Root Cause Analysis Diagram Using Solutions

Root Cause Analysis diagram is used to analyze the root causes of factors that influence the problem. If the certain factor is the root cause, this mean that its vanishing will help to prevent the further recurrence of the problem. Root Cause diagram helps to identify the root causes for a factor and then propose possible corrective actions. A diagram is constructed separately for each high priority factor. The ability to create a RCA tree diagram from a mind map is supported by the ConceptDraw Seven Management and Planning Tools solution.

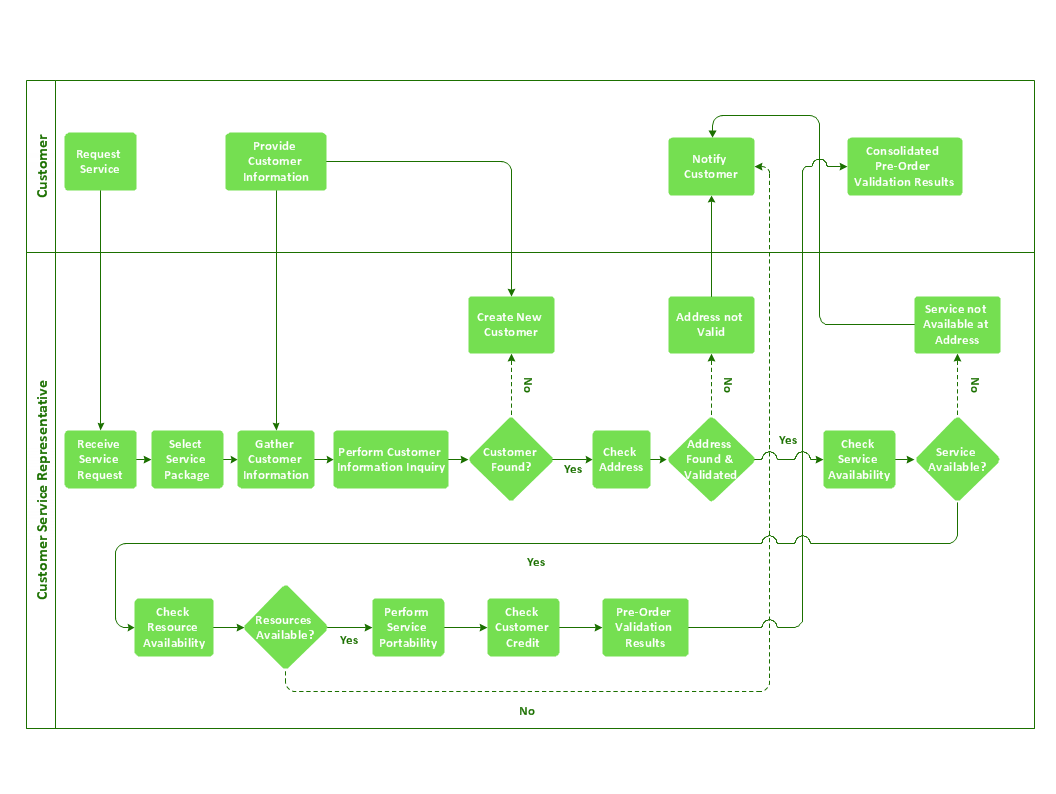
Cross-Functional Flowchart Basics

Don't let your first glance fool you. ConceptDraw is a lot easier to use than it looks. Use its cross-functional templates and library as basics to get started.
All you need to know are a few basic steps and terms.

ConceptDraw Arrows10 Technology is a new age in drawing software. Use it for process flows and its new rapid draw feature enables to draw an impressive charts in a seconds.

Activity Network Diagram Method

Activity Network Diagram - This sample was created in ConceptDraw DIAGRAM diagramming and vector drawing software using the Seven Management and Planning Tools solution from the Management area of ConceptDraw Solution Park.
This sample shows the PERT (Program Evaluation Review Technique) chart of the request on proposal. A request for proposal (RFP) is a request of the company or the organization to potential suppliers to submit the business proposals for service or goods that it is interested to purchase. The RFP is represented on the initial procurement stage and allows to define the risks and benefits.

Business Processes

The most worked out and commonly used methodology of business processes description is IDEF methodology. Besides business processes it allows to describe functional blocks, for example production and marketing. ConceptDraw lets creation of business processes description using IDEF0 and IDEF2 methods.

Decision Making

Decision Making - ConceptDraw OFFICE suite provides visual tools that are given support on the stage of the decision making.
The Seven Management and Planning Tools is a set for such diagrams: Affinity Diagram, Relations Diagram, Prioritization Matrix, Root Cause Tree Diagram, Involvement Matrix, PERT Chart, Risk Diagram (PDPC).

Fundamental Tool in Quality Management

ConceptDraw MINDMAP is a fundamental tool in quality management to describe visual instructions on any process.

CORRECTIVE ACTIONS PLANNING. Involvement Matrix

The Involvement Matrix can identify the distribution of responsibilities and identify roles in a group or team. Use the Involvement Matrix to specify roles and responsibilities of actions in problem solving.
ConceptDraw Office suite is a software for corrective actions planning.
7MP Tools
7MP Tools

The Action Plan

Action Plan - For the action planning define people and groups involvement in corrective actions by roles, identify logical sequences of scheduled actions and critical path of problem solving, identify possible risks of action plan and propose preventive actions.
ConceptDraw Office suite is a software for decision making and action plan.
7MP Tools
7MP Tools

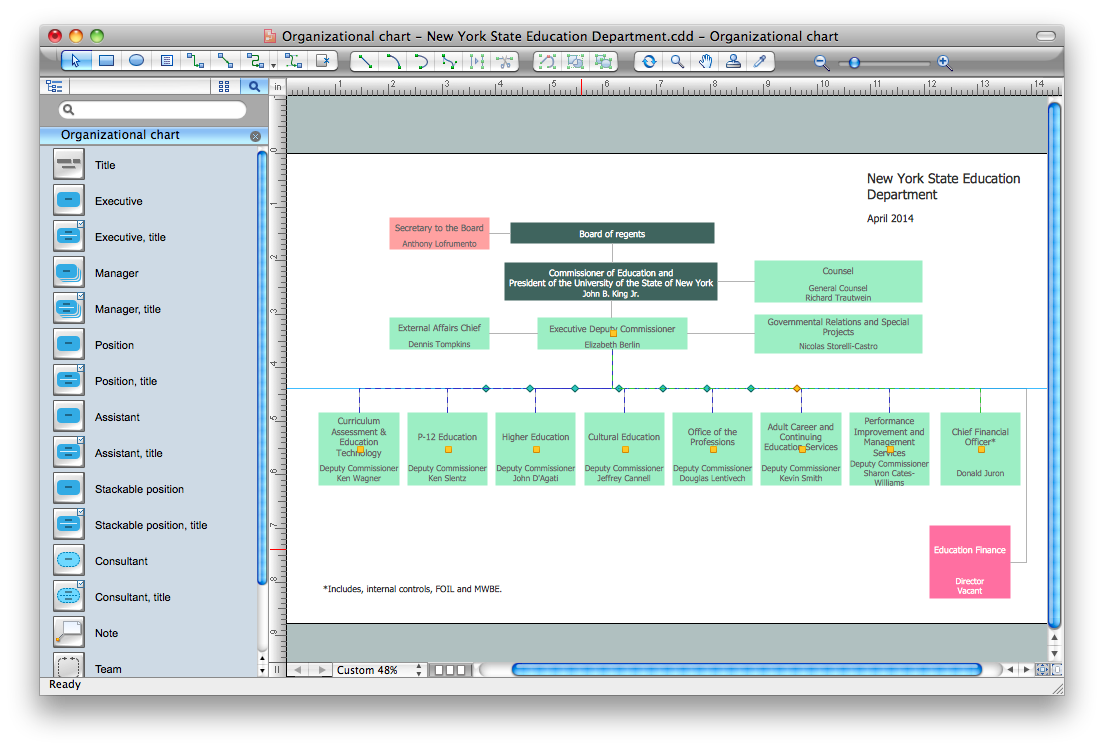
Organization Chart Software

Create Organizational Chart Software - You need create Organizational Chart? Nothing could be easier with ConceptDraw DIAGRAM diagramming and vector drawing software. ConceptDraw DIAGRAM presents the Organizational Charts Solution from the Management Area that will allow you to draw the Organization Charts of any difficulty easy and quick.
How to draw an Organizational Chart

How To Make a Bubble Chart

Bubble diagrams solution extends ConceptDraw DIAGRAM software with templates, Using ConceptDraw Connectors, you can make a bubble chart in moments. Using ConceptDraw you will be able to make a bubble chart from the ready ConceptDraw library objects or make your own objects. The created diagram can represent ideas organization, in brainstorming processes, by teachers for explaining difficult ideas or for presentations.

Activity Network (PERT) Chart

Activity Network and Project Evaluation and Review Technique, or PERT, charts are a way of documenting and analyzing the tasks in a project.
This diagram is constructed as part of the process in creating a schedule of corrective actions. The Activity Network Chart (PERT) shows the logical connections and consequence of tasks to be performed. It displays the time period for problem solving and the implementation of all activities through the critical path.

PERT Chart Software

PERT Chart Software - Activity Network and Project Evaluation and Review Technique, or PERT, charts are a way of documenting and analyzing the tasks in a project.
ConceptDraw DIAGRAM is a powerful diagramming and vector drawing software for designing professional looking PERT Charts quick and easy.

Prioritization Matrix

You can design the Prioritization Matrix by hand on the paper, but we offer you the most easier way — to use the ConceptDraw DIAGRAM diagramming and vector drawing software extended with Seven Management and Planning Tools Solution from the Management Area.

Mac Tools - SWOT Analysis

The ConceptDraw DIAGRAM provides Mac Tools for drawing SWOT Analysis diagrams.

CORRECTIVE ACTIONS PLANNING. Risk Diagram (PDPC)

Risk Diagram (PDPC) - ConceptDraw OFFICE suite is a software for Risks Diagram making. This diagram identifies possible risks in accomplishing corrective actions. With the Risks Diagram, one analyzes each action separately in a tree of all actions and develops a preventive action in response of each potential obstacles or circumstances which may be a risk.
7MP Tools
7MP Tools