PROBLEM ANALYSIS. Identify and Structure Factors


Problem Analysis
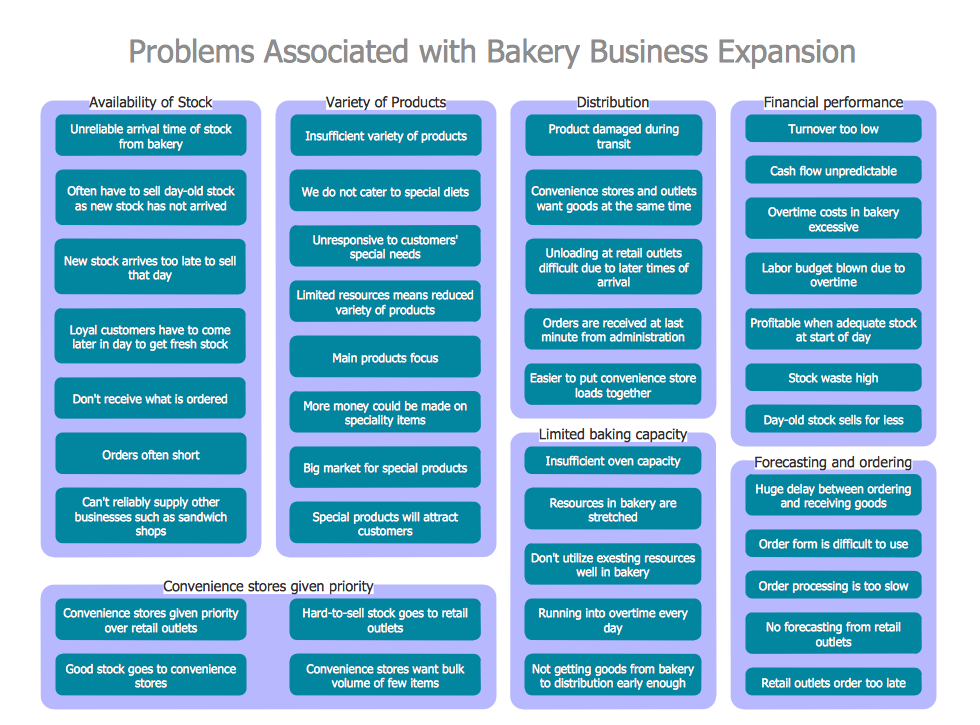
Affinity Diagram

Affinity Diagram

 Seven Management and Planning Tools
Seven Management and Planning Tools solution extends ConceptDraw DIAGRAM and ConceptDraw MINDMAP with features, templates, samples and libraries of vector stencils for drawing management mind maps and diagrams.
Root Cause Tree Diagram
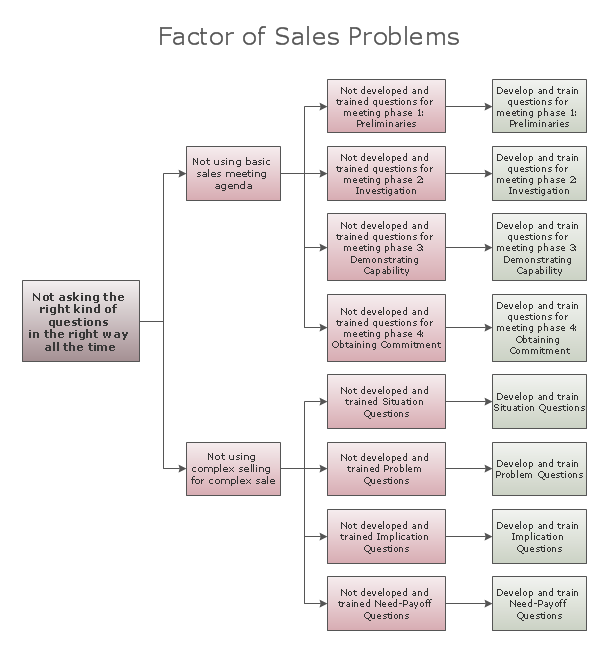
 Seven Management and Planning Tools
Seven Management and Planning Tools solution extends ConceptDraw DIAGRAM and ConceptDraw MINDMAP with features, templates, samples and libraries of vector stencils for drawing management mind maps and diagrams.
Bar Diagrams for Problem Solving. Create business management bar charts with Bar Graphs Solution

Project — Working With Tasks

PDPC

Communication Tool for Remote Project Management

CORRECTIVE ACTIONS PLANNING. PERT Chart

Why People Select ConceptDraw MINDMAP

Emergency Plan


Activity Network (PERT) Chart

- Process Flowchart | PROBLEM ANALYSIS. Root Cause Analysis ...
- Total Quality Management | Affinity Diagram | PROBLEM ANALYSIS ...
- PROBLEM ANALYSIS. Root Cause Analysis Tree Diagram | Affinity ...
- Affinity Diagram | PDPC | PROBLEM ANALYSIS . Root Cause ...
- Using Fishbone Diagrams for Problem Solving | PROBLEM ...
- Affinity Diagram Software | Affinity Diagram | How To Create an ...
- PROBLEM ANALYSIS . Identify and Structure Factors | Affinity ...
- Root Cause Tree Diagram | Communication Tool for Remote Project ...
- Affinity Diagram | Affinity Diagram | Prioritization Matrix | Affinity ...
- Affinity Diagram | How To Create an Affinity Diagram Using ...
- Affinity Diagram Software | Affinity Diagram | Affinity Diagram ...
- Value-Stream Mapping for Manufacturing | Bar Diagrams for ...
- Affinity Diagram Software | Affinity diagram - Template | Affinity ...
- PROBLEM ANALYSIS . Prioritization Matrix | Cause and Effect ...
- Root Cause Tree Diagram | How To Create Root Cause Analysis ...
- Affinity Diagram | Affinity Diagram Software | Affinity Diagram ...
- SWOT Analysis | SWOT Matrix | PROBLEM ANALYSIS . Root Cause ...
- How To Create an Affinity Diagram Using ConceptDraw Office ...
- Affinity Diagram | Business Diagram Software | Marketing ...
- Pie Charts | Life cycle analysis - Ring chart | UK Map | Natural ...