Affinity Diagram Software

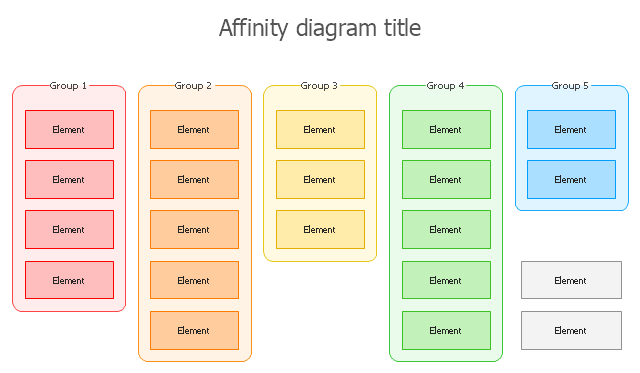
The affinity diagram shows the structure of complex factors that have an influence on a problem, and then divides them up into a smaller and simpler structure. This diagram is designed to prepare the data for further analysis of the cause-effect relationships.
"Affinity diagrams are a special kind of brainstorming tool that organize large amounts of disorganized data and information into groupings based on natural relationships.
It was created in the 1960s by the Japanese anthropologist Jiro Kawakita. Its also known as KJ diagram,after Jiro Kawakita.When to Use an Affinity Diagram: 1) When you are confronted with many facts or ideas in apparent chaos. 2) When issues seem too large and complex to grasp." [Seven Management and Planning Tools. Wikipedia]
The affinity diagram is one of the Seven Management and Planning Tools (7 MP tools, Seven New Quality Tools).
The affinity diagram template for the ConceptDraw PRO diagramming and vector drawing software is included in the solution "Seven Management and Planning Tools" from the Management area of ConceptDraw Solution Park.
Affinity diagram template
Affinity Diagram

PROBLEM ANALYSIS. Root Cause Analysis Tree Diagram


Total Quality Management

Cause and Effect Fishbone Diagram

Learn how to create a current state value stream map

PROBLEM ANALYSIS. Prioritization Matrix

Decision Making

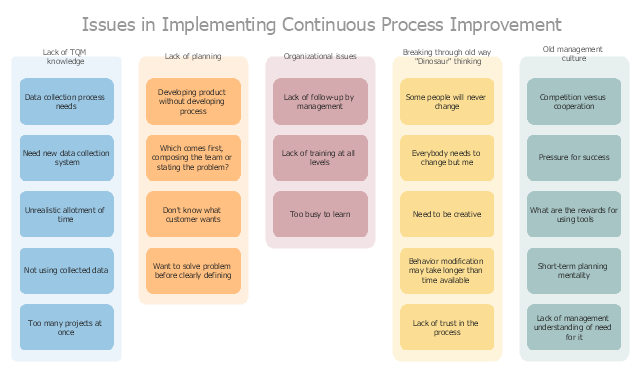
"A continual improvement process, also often called a continuous improvement process (abbreviated as CIP or CI), is an ongoing effort to improve products, services, or processes. These efforts can seek "incremental" improvement over time or "breakthrough" improvement all at once. Delivery (customer valued) processes are constantly evaluated and improved in the light of their efficiency, effectiveness and flexibility.
Some see CIPs as a meta-process for most management systems (such as business process management, quality management, project management, and program management)." [Continual improvement process. Wikipedia]
The affinity diagram example "Implementing continuous process improvement" was created using the ConceptDraw PRO diagramming and vector drawing software extended with the solution "Seven Management and Planning Tools" from the Management area of ConceptDraw Solution Park.
Affinity diagram
 Seven Management and Planning Tools
Seven Management and Planning Tools solution extends ConceptDraw DIAGRAM and ConceptDraw MINDMAP with features, templates, samples and libraries of vector stencils for drawing management mind maps and diagrams.
 Seven Management and Planning Tools
Seven Management and Planning Tools solution extends ConceptDraw DIAGRAM and ConceptDraw MINDMAP with features, templates, samples and libraries of vector stencils for drawing management mind maps and diagrams.
Workflow Diagram

Prioritization Matrix

CORRECTIVE ACTIONS PLANNING. Involvement Matrix

- Affinity Diagram Software | Affinity Diagram | How To Create an ...
- Total Quality Management | Affinity Diagram | Prioritization Matrix ...
- Affinity Diagram Quality Management
- Quality Improvement | Organizational Structure Total Quality ...
- House of Quality Matrix Software | Affinity Diagram Software | Seven ...
- New Seven Managnent Tools Diagram
- Affinity Diagram | Affinity diagram - Template | How To Create an ...
- Affinity diagram - Implementing continuous process improvement ...
- Seven Management and Planning Tools | Affinity diagram ...
- Seven Management and Planning Tools | Seven Basic Tools of ...
- Affinity Diagram | Affinity diagram - Template | Affinity Diagram ...
- How To Create an Affinity Diagram Using ConceptDraw Office ...
- Process Flowchart | Affinity Diagram | Root Cause Tree Diagram ...
- Affinity Diagram | Affinity Diagram Software | Affinity Diagram ...
- Affinity diagram - Implementing continuous process improvement ...
- Affinity Diagram | Affinity Diagram | Total Quality Management | Work ...
- Affinity Diagram | Affinity diagram - Implementing continuous ...
- PDPC | Prioritization Matrix | Affinity Diagram | Pdpc Ppt
- Affinity Diagram | Affinity diagram - Implementing continuous ...
- Affinity diagram - Implementing continuous process improvement