CORRECTIVE ACTIONS PLANNING. Risk Diagram (PDPC)
 - Health care")

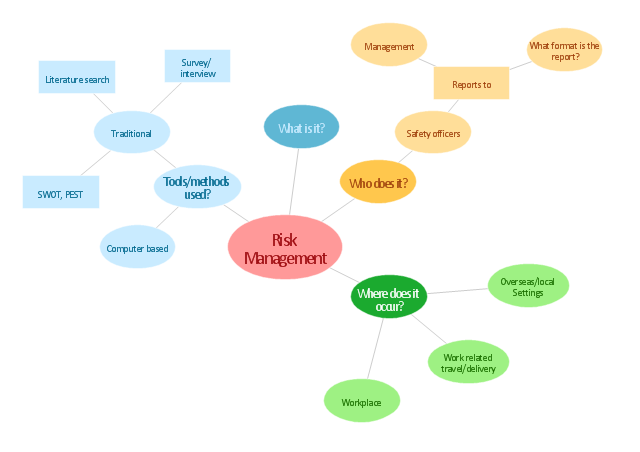
"Risk management is the identification, assessment, and prioritization of risks (defined in ISO 31000 as the effect of uncertainty on objectives, whether positive or negative) followed by coordinated and economical application of resources to minimize, monitor, and control the probability and/ or impact of unfortunate events or to maximize the realization of opportunities. Risks can come from uncertainty in financial markets, threats from project failures (at any phase in design, development, production, or sustainment life-cycles), legal liabilities, credit risk, accidents, natural causes and disasters as well as deliberate attack from an adversary, or events of uncertain or unpredictable root-cause. ... Methods, definitions and goals vary widely according to whether the risk management method is in the context of project management, security, engineering, industrial processes, financial portfolios, actuarial assessments, or public health and safety.
The strategies to manage threats (uncertainties with negative consequences) typically include transferring the threat to another party, avoiding the threat, reducing the negative effect or probability of the threat, or even accepting some or all of the potential or actual consequences of a particular threat, and the opposites for opportunities (uncertain future states with benefits)." [Risk management. Wikipedia]
The concept map example "Risk management" was created using the ConceptDraw PRO diagramming and vector drawing software extended with the Concept Maps solution from the area "What is a Diagram" of ConceptDraw Solution Park.
Concept map
Sales Process Flowchart Symbols

 Seven Management and Planning Tools
Seven Management and Planning Tools solution extends ConceptDraw PRO and ConceptDraw MINDMAP with features, templates, samples and libraries of vector stencils for drawing management mind maps and diagrams.
Internal Audit Process

Competitor Analysis

 Sales Flowcharts
The Sales Flowcharts solution lets you create and display sales process maps, sales process workflows, sales steps, the sales process, and anything else involving sales process management.
Network Security Devices

 Stakeholder Onion Diagrams
The Stakeholder Onion Diagram is often used as a way to view the relationships of stakeholders to a project goal. A basic Onion Diagram contains a rich information. It shows significance of stakeholders that will have has influence to the success achieve
Stakeholder Management System

 Rapid UML
Rapid UML solution extends ConceptDraw PRO software with templates, samples and libraries of vector stencils for quick drawing the UML diagrams using Rapid Draw technology.
Chart Audits. Chart Auditor

 Circle-Spoke Diagrams
Examples of subject areas that are well suited to this approach are marketing, business, products promotion, process modeling, market, resource, time, and cost analysis. Circle-Spoke Diagrams are successfully used in presentations, conferences, management documents, magazines, reportages, reviews, reports, TV, and social media.
 Audit Flowcharts
Audit flowcharts solution extends ConceptDraw PRO software with templates, samples and library of vector stencils for drawing the audit and fiscal flow charts.
- Risk management - Concept map
- Concept Map Risk Management
- Risk management - Concept map | How To Make a Concept Map ...
- Risk management - Concept map | Concept Map On Disaster Risk
- Team psychological characteristics - Concept map | Safety and ...
- CORRECTIVE ACTIONS PLANNING. Risk Diagram (PDPC) | Risk ...
- Value Stream Mapping | Business Tools Perceptual Mapping | Risk ...
- Risk management - Concept map | Mind Map Making Software ...
- Team psychological characteristics - Concept map | Risk ...
- Risk Assessment With Diagram
- Risk Management Concept Diagram
- Project Management Concept Map
- Risk Assessment
- Mind Map Risk Assessment
- Food security assessment - Flowchart | Flowcharts | Contoh ...
- Diagram Of Market Assessment
- Value Stream Mapping | Risk management
- It Security Risks
- Risk Assessment Flowchart
- CMP adaptive management cycle | Project management life cycle ...