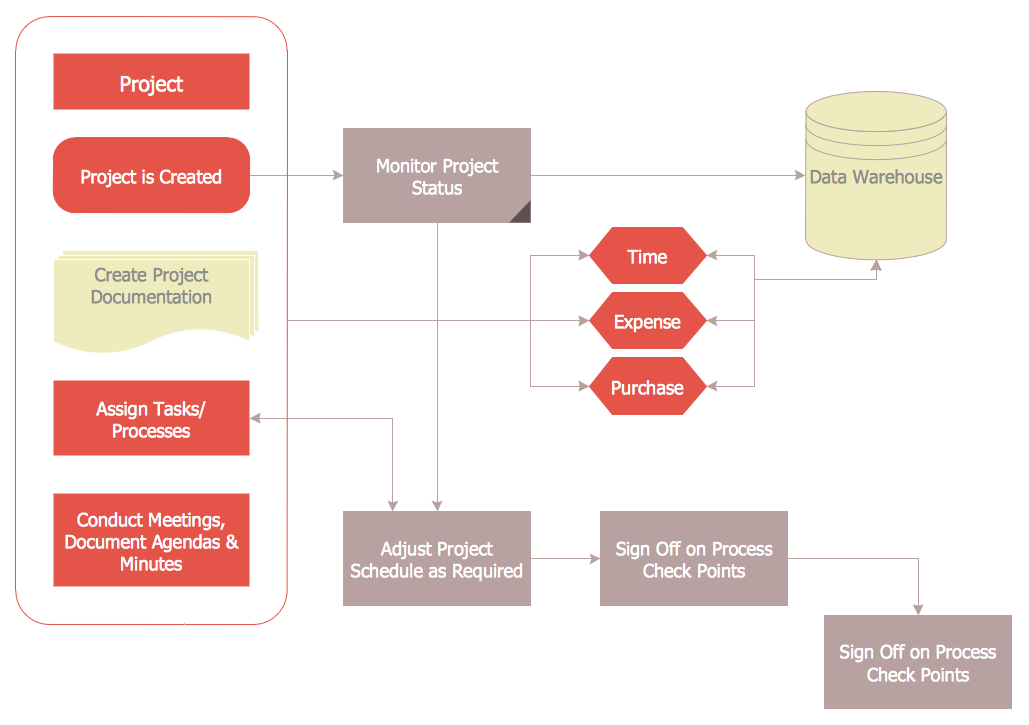
Sample 2. Chart Auditor — Project Management Process
This sample was created in ConceptDraw DIAGRAM using the Audit Flowcharts library from the Audit Flowcharts Solution and shows the flow of the project management process audit. An experienced user spent 10 minutes creating this sample.
Use the ConceptDraw DIAGRAM with Audit Flowcharts Solution to create your own professional Chart Audits and Audit Flowcharts quick and easy.
The Audit Flowcharts produced with ConceptDraw DIAGRAM are vector graphic documents and are available for reviewing, modifying, and converting to a variety of formats (image, HTML, PDF file, MS PowerPoint Presentation, Adobe Flash or MS Visio).
See also:
NINE RELATED HOW TO's:
A flowchart is a widely used type of diagram that visually represents an algorithm, workflow or process, using the boxes of various kinds to depict the steps and connecting them with arrows to show the order of execution these steps. Еhe ConceptDraw DIAGRAM supplied with Accounting Flowcharts Solution from the Finance and Accounting Area of ConceptDraw Solution Park is a powerful diagramming and vector drawing software which ideally suits for designing Ordering Process Flowchart of any complexity.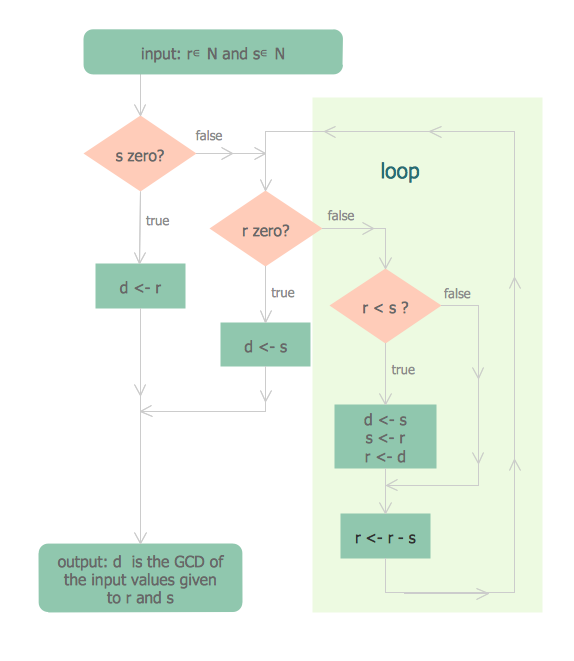
Picture: Ordering Process Flowchart. Flowchart Examples
Related Solution:
Learn the most common process flowchart symbols used in business process diagrams and workflow charts. Includes symbol meanings, examples, and a practical reference table.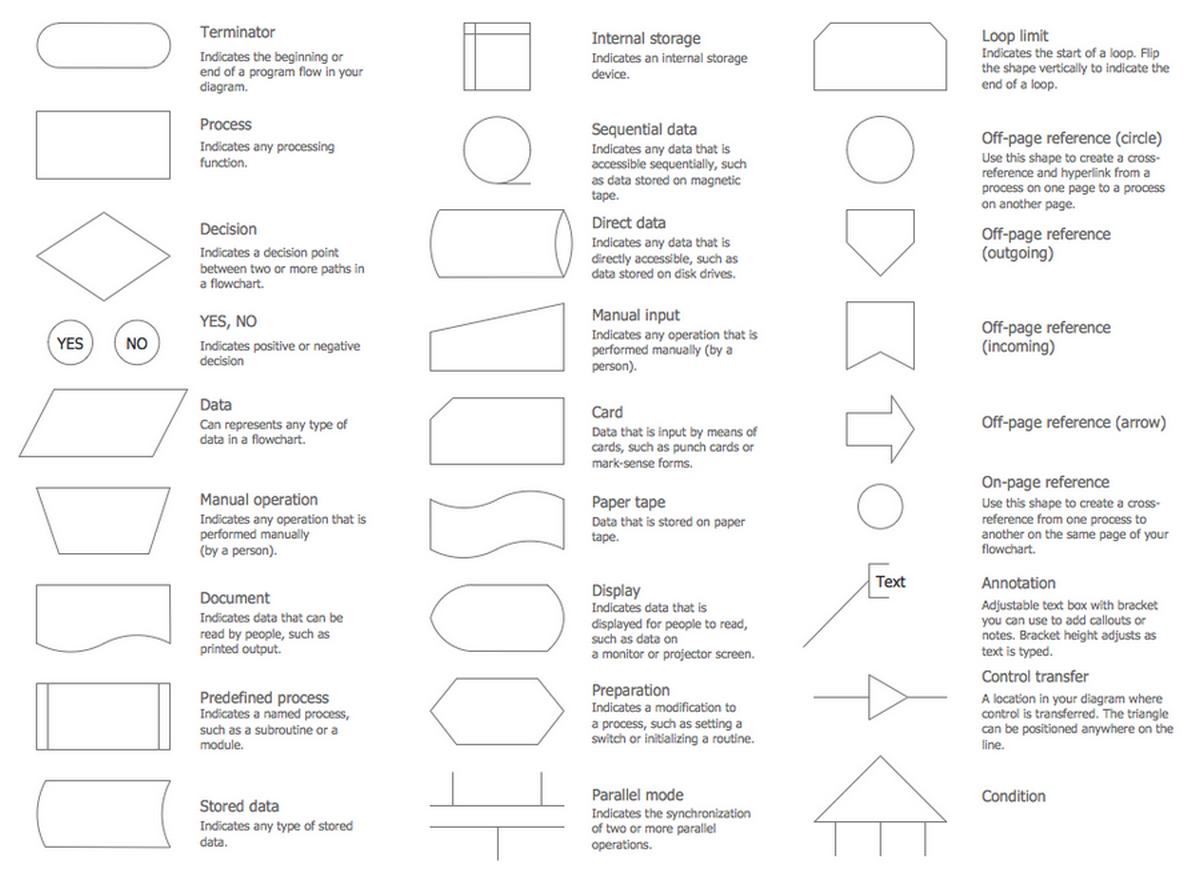
Picture: Process Flowchart Symbols: Meaning, Types and Examples
Related Solution:
Chart Audits, Chart Auditor - Designing the chart auditor can use the audit flowchart symbols from the Audit Flowcharts library for Audit Flowcharts Solution. Moreover it is convenient to use anyone of samples or templates offered by Audit Flowcharts Solution and design its own chart audits and audit flowcharts on the base of them.Picture: Chart Audits. Chart Auditor
Related Solution:
This sample was created in ConceptDraw DIAGRAM diagramming and vector drawing software using the UML Class Diagram library of the Rapid UML Solution from the Software Development area of ConceptDraw Solution Park.
This sample shows the structure of the building and can be used by building companies, real estate agencies, at the buying / selling of the realty.
Picture: UML Class Diagram Example - Buildings and Rooms
Related Solution:
Steps in the Accounting Process - The Accounting Process is a sequence of organization activities that is used for gaining quantitative information about the finances. This complex process consists of a set of sequential steps.
9 steps in the accounting process: Analysis of Business Transactions, Make Journal Entries, Post to Ledger Accounts, Prepare Trial Balance, Make Adjusting Entries, Adjusted Trial Balance, Prepare Financial Statements, Close Accounts, Post-Closing Trial Balance.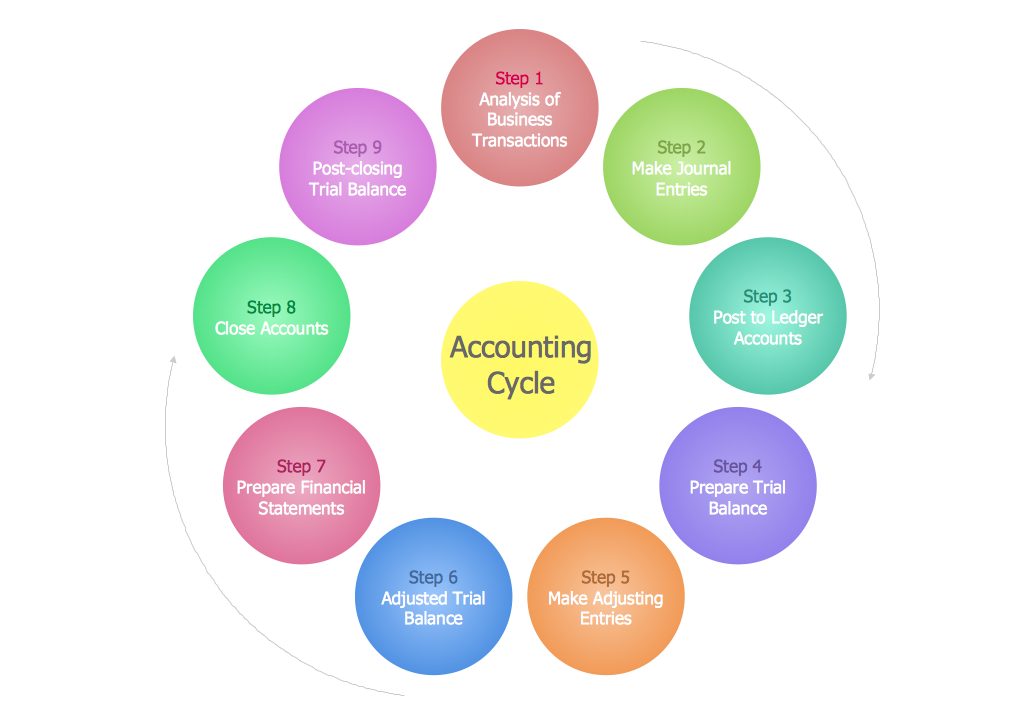
Picture: Steps in the Accounting Process
Related Solution:
Tips on how to make an accounting flowchart. Describing methods and symbols that are used to represent the accounting system.
Picture: How to Make an Accounting Process Flowchart
Related Solution:
ConceptDraw DIAGRAM has extensive export capabilities which allow you to export your drawing to MS PowerPoint file formats. So, you can create effective presentations right from your ConceptDraw DIAGRAM documents.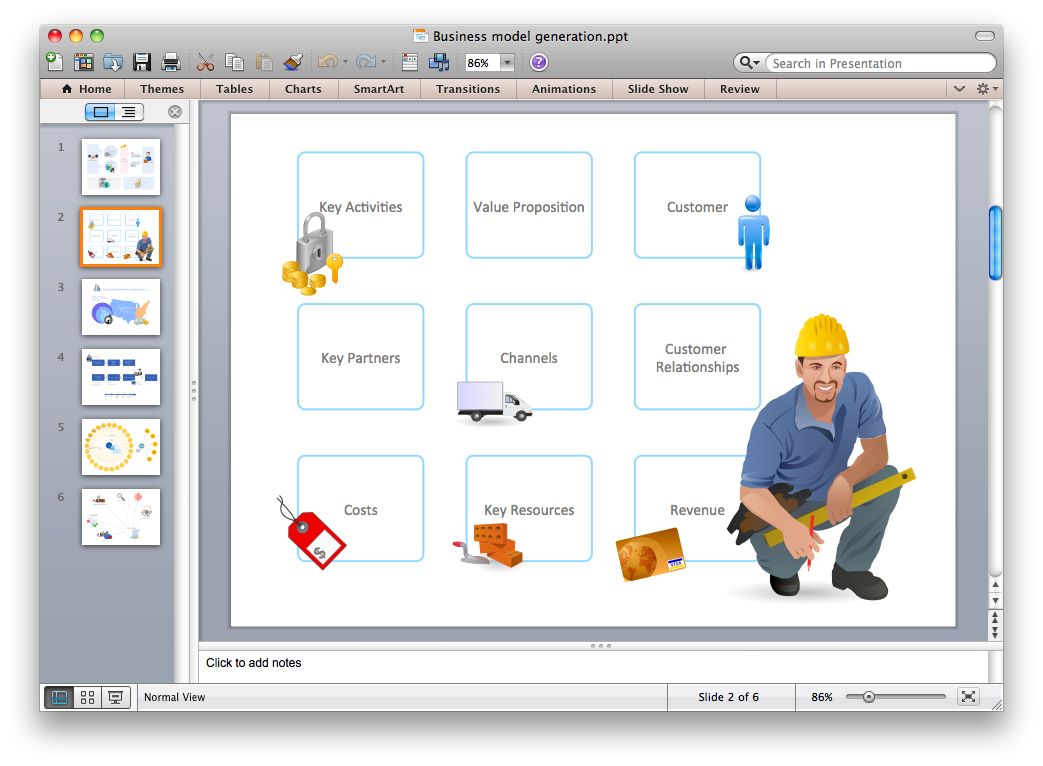
Picture: Export from ConceptDraw DIAGRAM Document to PPT or PPTX (MS PowerPoint®) File
This sample shows the Flowchart for determine is a species heterotroph or autotroph, or a subtype. This diagram has start point and end points. The diamonds on the Flowchart represent the decisions. The Flowcharts are widely used in science, analytics, government, politics, business, engineering, architecture, marketing, manufacturing, administration, etc.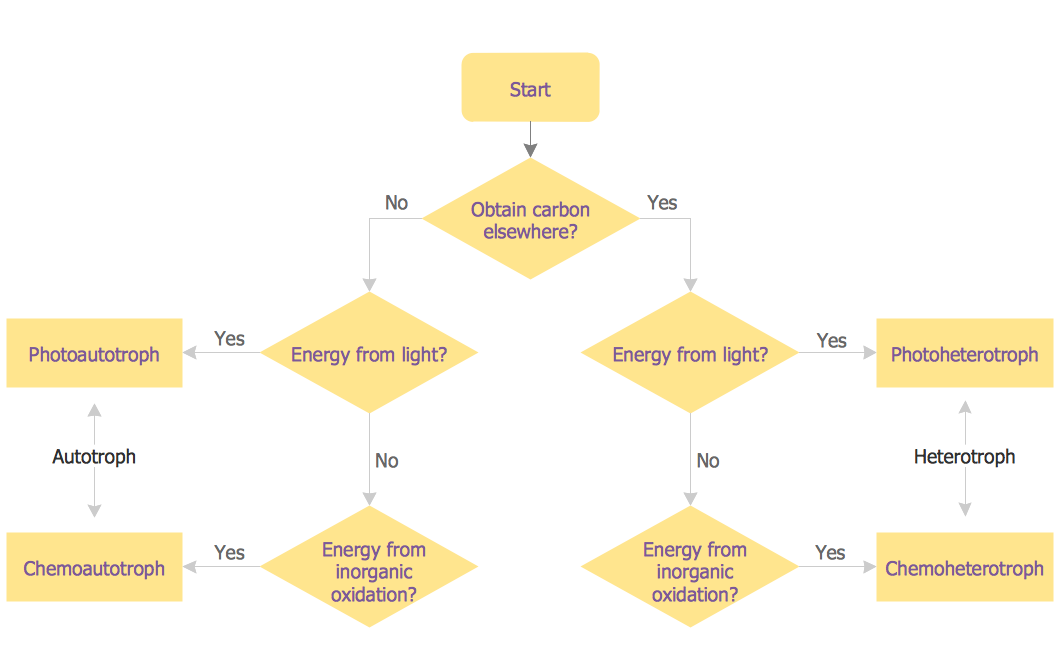
Picture: Samples of Flowcharting
Related Solution:
Working with information can be quite tedious, furthermore, some data can be quite difficult to perceive without any graphic representation. So, to facilitate your work, you can use business diagrams, such as simple flowcharts or Gantt charts for project management and orgcharts for clarifying your company structure. You can use a proper software, like ConceptDraw Pro, draw them on paper, or use whiteboards, but it is more convenient to use a digital tool.
This diagram shows a cross-functional flowchart that was made fore telecom service provider. A workflow of a common telecommunication service provider has a rather branched structure. Thus, it is useful to have a flow chart to visualize the sequences and interrelations of the work flow steps. Business process flowchart contains 17 processes and 4 decision points,that are distributed through 2 lines depicting the participants involved. Also there are connectors that show the data flow within processes. This flowchart displays a detailed model of the telecom service trading process, as well as all participants in the process and how they interact with each other.
Picture: Business diagrams & Org Charts with ConceptDraw DIAGRAM
