Value Stream Mapping Icons
The vector stencils library "Workflow diagrams" contains 54 symbol icons of workflow diagrams.
The workflow diagrams represent information flow, automation of business processes, business process re-engineering, accounting, management, and human resources tasks in industry, business, and manufacturing.
Use this library to draw workflow diagrams in the ConceptDraw PRO diagramming and vector drawing software extended with the Workflow Diagrams solution from the Business Processes area of ConceptDraw Solution Park.
www.conceptdraw.com/ solution-park/ business-process-workflow-diagrams
Accounting

Accounts Payable

Accounts Receivable

Bank

Board of Directors

Copy Center

Customer Service

Distribution

Finance

Information Systems

International Division

International Marketing

International Sales

Inventory

Legal Department

Mailroom 2

Mailroom 1

Management

Manufacturing

Marketing

Motor Pool

Packaging

Payroll

Person 1

Person 2

Personnel/ Staff

Publications

Purchasing

Quality Assurance

Exchange

Reception

Research and Development

Sale contract

Shipping

Suppliers

Telecommunications

Treasurer

Warehouse

Lorry

Quality

Production

Box

Boxes

Open box

Payment

Receiving

Sales

Phone

Operator 1

Online booking

Operator 2

Server

Car

Mini truck

The vector stencils library "Workflow departments" contains 47 icons.
Use it to design your business process workflow diagrams with ConceptDraw PRO software.
"Departmentalization ...
Division of labour creates specialists who need coordination. This coordination is facilitated by grouping specialists together in departments. ...
Functional departmentalization - Grouping activities by functions performed. Activities can be grouped according to function (work being done) to pursue economies of scale by placing employees with shared skills and knowledge into departments for example human resources, IT, accounting, manufacturing, logistics, and engineering. Functional departmentalization can be used in all types of organizations. ...
Process departmentalization - Grouping activities on the basis of product or service or customer flow. Because each process requires different skills, process departmentalization allows homogenous activities to be categorized. For example, the applicants might need to go through several departments namely validation, licensing and treasury, before receiving the driver’s license." [Departmentalization. Wikipedia]
The icons example "Design elements - Workflow departments" is included in the Business Process Workflow Diagrams solution from the Business Processes area of ConceptDraw Solution Park.
Department icons
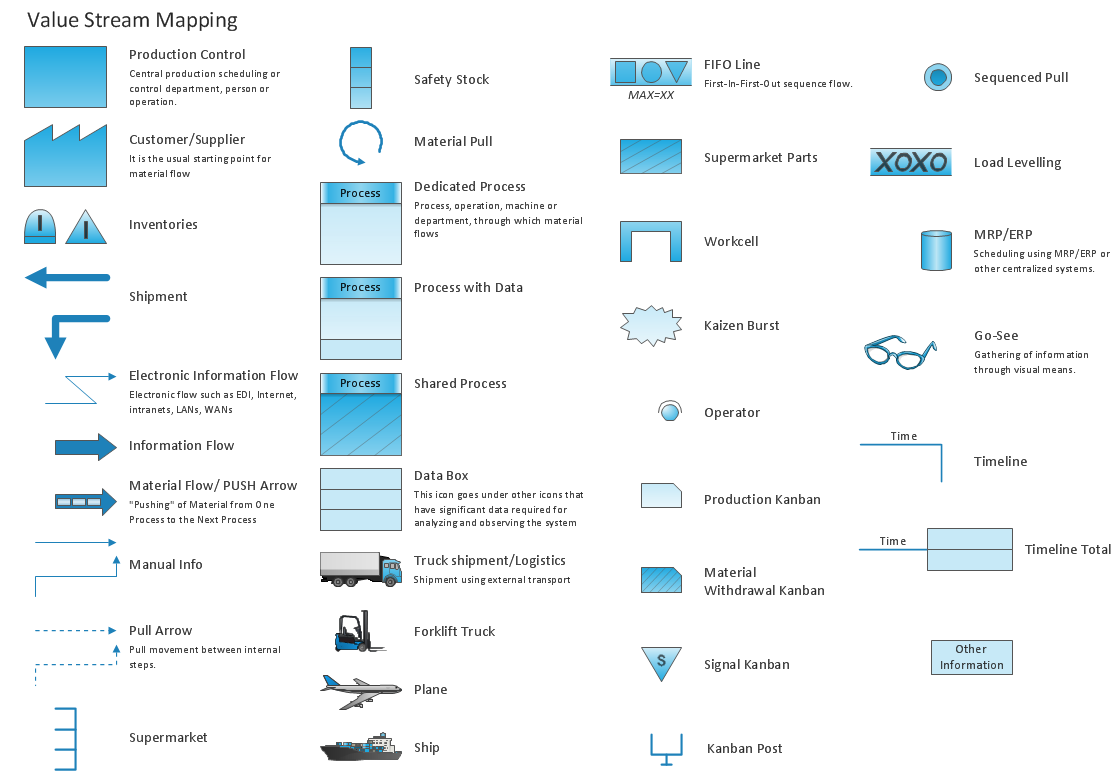
Value Stream Mapping Symbols

Network Topologies


Standard Shapes for Value Stream Mapping
Value Stream Mapping Software
Network Diagram Software


Lean Manufacturing Diagrams

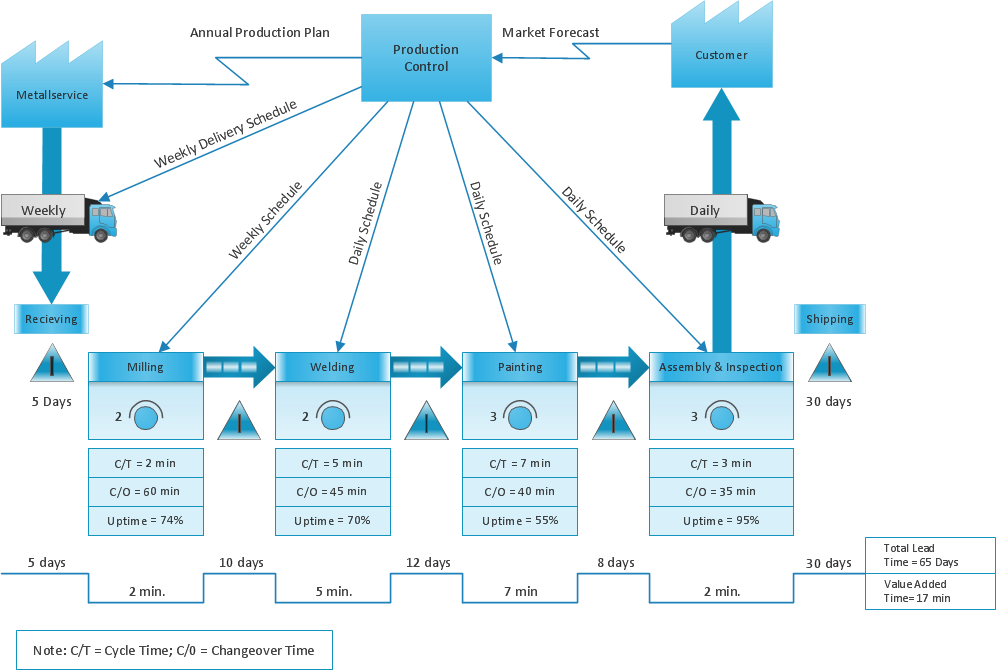
"Value stream mapping is a lean management principle used to analyze and design the flow of materials and information required to bring a product or service to a consumer. Pioneered by Henry Ford in the 1920s, perfected by Toyota. At Toyota, it is known as "material and information flow mapping". It can be applied to nearly any value chain. ...
Value stream mapping has supporting methods that are often used in Lean environments to analyze and design flows at the system level (across multiple processes).
Although value stream mapping is often associated with manufacturing, it is also used in logistics, supply chain, service related industries, healthcare, software development, product development, and administrative and office processes." [Value stream mapping. Wikipedia]
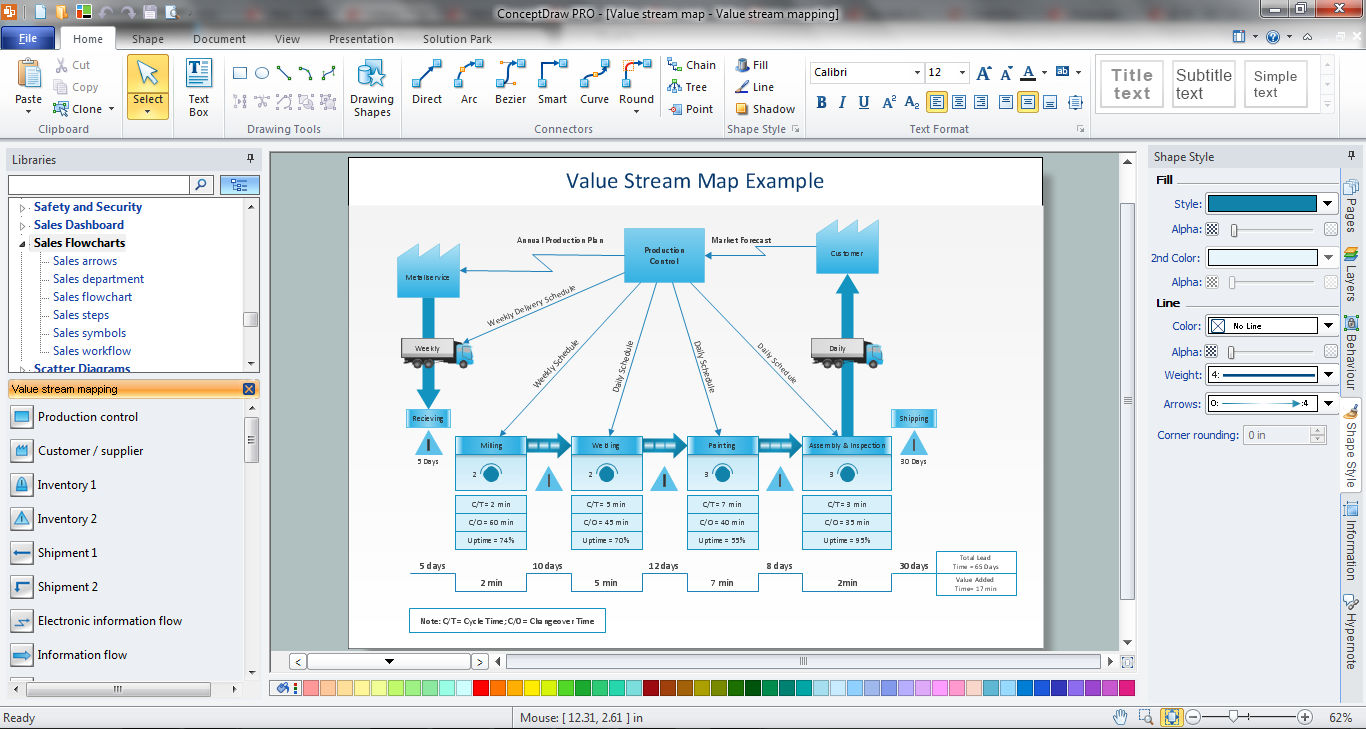
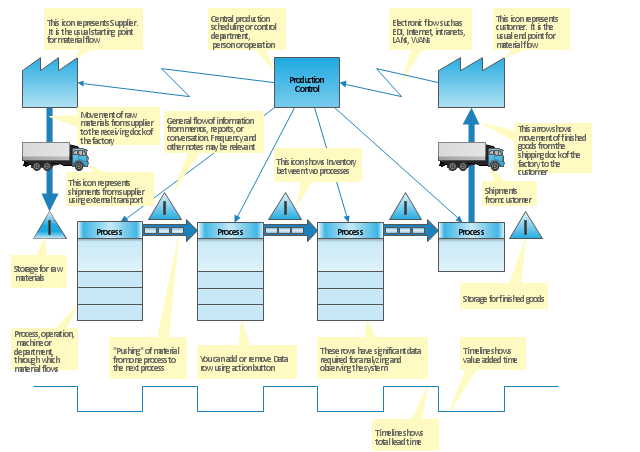
This value stream map template explains the meanings of the VSM design elements.
This Value stream map template for the ConceptDraw PRO diagramming and vector drawing software is included in the Value Stream Mapping solution from the Quality area of ConceptDraw Solution Park.
Value stream mapping has supporting methods that are often used in Lean environments to analyze and design flows at the system level (across multiple processes).
Although value stream mapping is often associated with manufacturing, it is also used in logistics, supply chain, service related industries, healthcare, software development, product development, and administrative and office processes." [Value stream mapping. Wikipedia]
This value stream map template explains the meanings of the VSM design elements.
This Value stream map template for the ConceptDraw PRO diagramming and vector drawing software is included in the Value Stream Mapping solution from the Quality area of ConceptDraw Solution Park.
VSM template
The vector stencils library "Value stream mapping" contains 43 VSM symbols.
Use it for drawing value stream maps in the ConceptDraw PRO diagramming and vector drawing software extended with the Value Stream Mapping solution from the Quality area of ConceptDraw Solution Park.
www.conceptdraw.com/ solution-park/ business-value-stream-mapping
Use it for drawing value stream maps in the ConceptDraw PRO diagramming and vector drawing software extended with the Value Stream Mapping solution from the Quality area of ConceptDraw Solution Park.
www.conceptdraw.com/ solution-park/ business-value-stream-mapping
Inventory

Inventory

Information Flow

Shipment

Shipment

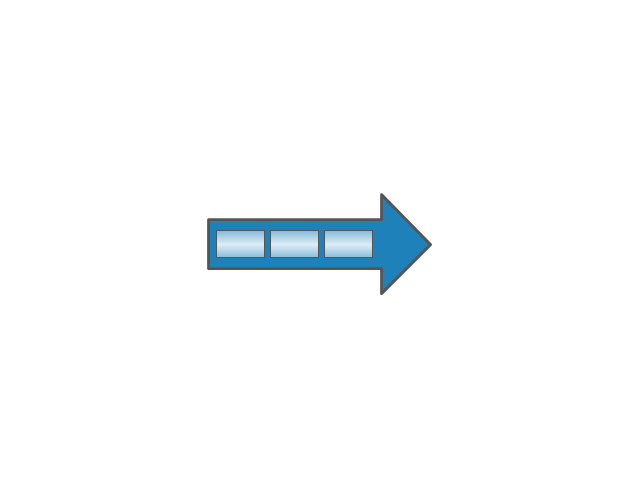
Material Flow
Material Pull

FIFO Line
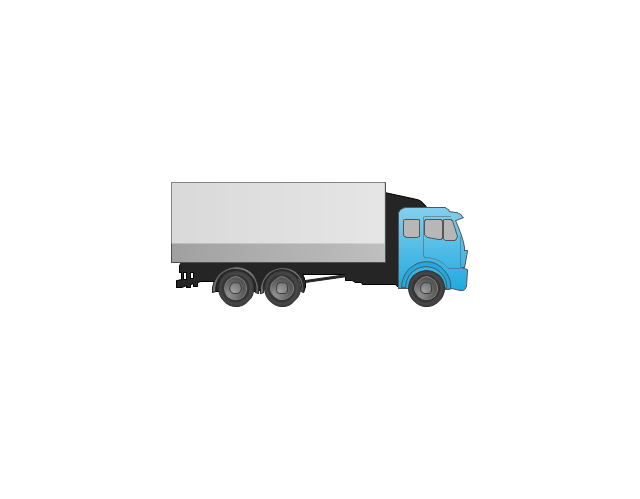
Truck shipment/Logistics
Customer/Supplier

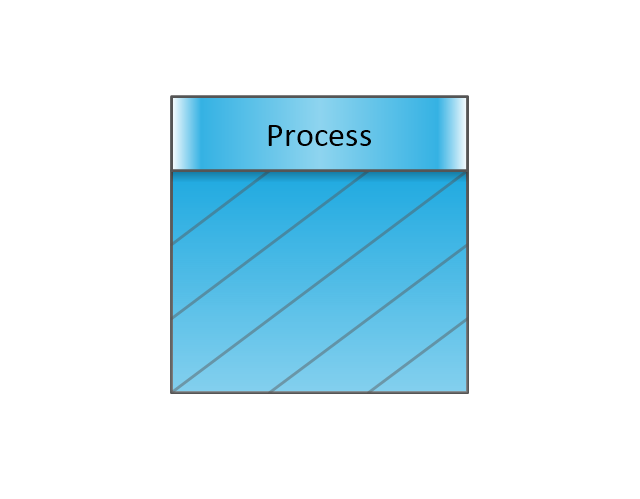
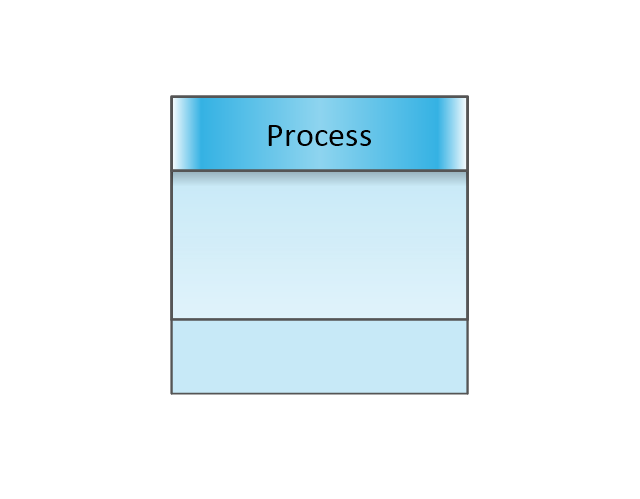
Dedicated Process

Shared Process
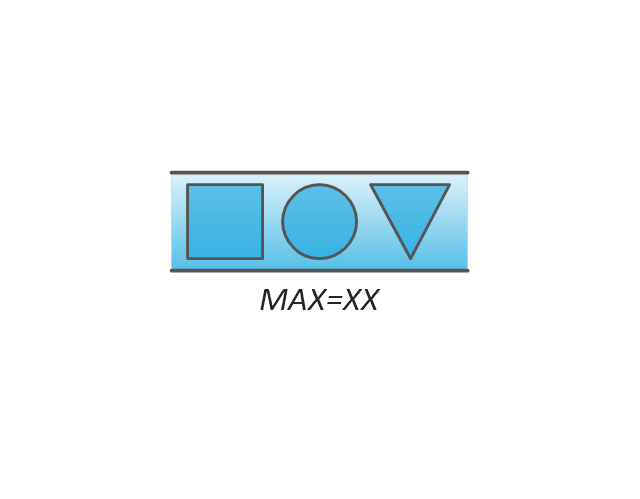
Supermarket Parts

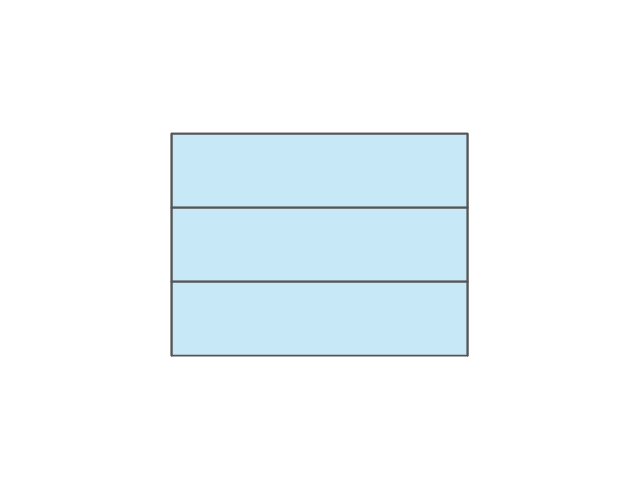
Data Box
Workcell

Kaizen Burst

Operator

Other
Production Control
Manual Info
Electronic Information Flow

Production Kanban

Withdrawal Kanban

Signal Kanban
Kanban Post

Sequenced Pull

Load Levelling

MRP/ERP
Go-See

Pull Arrow
Manual Info

Pull Arrow
Timeline Total
Ship
Forklift Truck
Plane

Process with Data
Timeline
Timeline
Supermarket, 2

Supermarket, 3

Safety stock, 2

Safety stock, 3

Value stream with ConceptDraw DIAGRAM

Flowchart Components

Learn how to create a current state value stream map

Create a Value Stream Map
- Van Icon Vector Png
- Truck Vector Png Icon
- Food Truck Icon
- Bulldozer Icon Vector Png
- AWS Simple Icons for Architecture Diagrams | Cisco IBM. Cisco ...
- Shipping Truck Vector
- Mini Trucks Black Cliparts Png
- Probability Quality Control Tools | Computer Network Diagrams ...
- Base Station Png Icon
- Ad Icon Png
- Tractor Icon
- Motorcycle Icon
- Cisco Network Topology. Cisco icons , shapes, stencils and symbols ...
- Car 2d Icon
- Truck Driver Icon
- Loading Pallet Icon Png
- Telecom Base Station Icon Png
- Vector Icon Ship Png
- Industrial transport - Vector stencils library | Aerospace and ...
- Sales Dept Icon Vector