 Seven Basic Tools of Quality
Manage quality control in the workplace, using fishbone diagrams, flowcharts, Pareto charts and histograms, provided by the Seven Basic Tools of Quality solution.
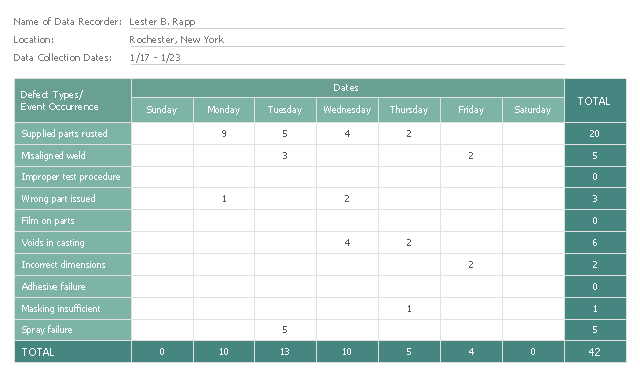
This check sheet example was redesigned from the Wikimedia Commons file: Check sheet for motor assembly.svg. [commons.wikimedia.org/ wiki/ File:Check_ sheet_ for_ motor_ assembly.svg]
This file is licensed under the Creative Commons Attribution-Share Alike 3.0 Unported license. [creativecommons.org/ licenses/ by-sa/ 3.0/ deed.en]
"The check sheet is a form (document) used to collect data in real time at the location where the data is generated. The data it captures can be quantitative or qualitative. When the information is quantitative, the check sheet is sometimes called a tally sheet.
The check sheet is one of the so-called Seven Basic Tools of Quality Control. ...
Kaoru Ishikawa identified five uses for check sheets in quality control:
- To check the shape of the probability distribution of a process
- To quantify defects by type
- To quantify defects by location
- To quantify defects by cause (machine, worker)
- To keep track of the completion of steps in a multistep procedure (in other words, as a checklist)" [. Wikipedia]
The example "Check sheet for motor assembly" was created using the ConceptDraw PRO software extended with the Seven Basic Tools of Quality solution from the Quality area of ConceptDraw Solution Park.
Check sheet example
Used Solutions
Quality
>
Seven Basic Tools of Quality — Quality Control

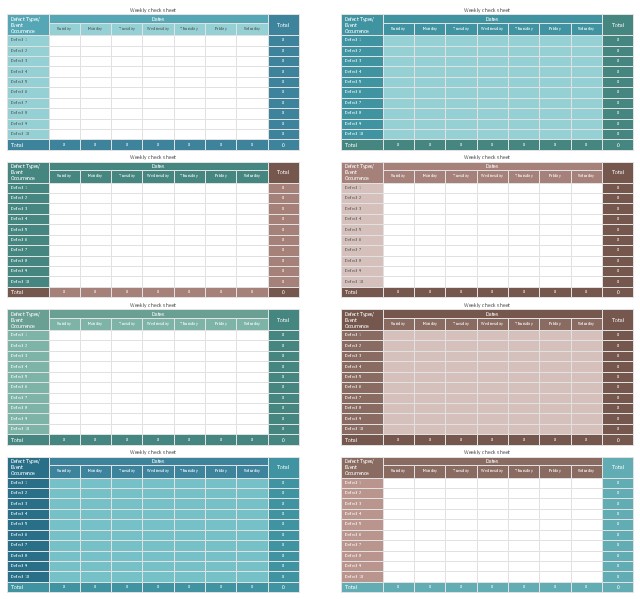
The vector stencils library "Check sheet" contains 8 templates of weekly check sheet.
Use it to design your check sheets with ConceptDraw PRO diagramming and vector drawing software.
"The check sheet is a form (document) used to collect data in real time at the location where the data is generated. The data it captures can be quantitative or qualitative. When the information is quantitative, the check sheet is sometimes called a tally sheet.
The check sheet is one of the so-called Seven Basic Tools of Quality Control." [Check sheet. Wikipedia]
The example of check sheet templates "Design elements - Check sheet" is included in the Seven Basic Tools of Quality solution from the Quality area of ConceptDraw Solution Park.
Weekly check sheet templates
This check sheet example was redesigned from the Wikimedia Commons file: Check sheet for motor assembly.svg. [commons.wikimedia.org/ wiki/ File:Check_ sheet_ for_ motor_ assembly.svg]
This file is licensed under the Creative Commons Attribution-Share Alike 3.0 Unported license. [creativecommons.org/ licenses/ by-sa/ 3.0/ deed.en]
"The check sheet is a form (document) used to collect data in real time at the location where the data is generated. The data it captures can be quantitative or qualitative. When the information is quantitative, the check sheet is sometimes called a tally sheet.
The check sheet is one of the so-called Seven Basic Tools of Quality Control. ...
Kaoru Ishikawa identified five uses for check sheets in quality control:
- To check the shape of the probability distribution of a process
- To quantify defects by type
- To quantify defects by location
- To quantify defects by cause (machine, worker)
- To keep track of the completion of steps in a multistep procedure (in other words, as a checklist)" [. Wikipedia]
The example "Check sheet for motor assembly" was created using the ConceptDraw PRO software extended with the Seven Basic Tools of Quality solution from the Quality area of ConceptDraw Solution Park.
This file is licensed under the Creative Commons Attribution-Share Alike 3.0 Unported license. [creativecommons.org/ licenses/ by-sa/ 3.0/ deed.en]
"The check sheet is a form (document) used to collect data in real time at the location where the data is generated. The data it captures can be quantitative or qualitative. When the information is quantitative, the check sheet is sometimes called a tally sheet.
The check sheet is one of the so-called Seven Basic Tools of Quality Control. ...
Kaoru Ishikawa identified five uses for check sheets in quality control:
- To check the shape of the probability distribution of a process
- To quantify defects by type
- To quantify defects by location
- To quantify defects by cause (machine, worker)
- To keep track of the completion of steps in a multistep procedure (in other words, as a checklist)" [. Wikipedia]
The example "Check sheet for motor assembly" was created using the ConceptDraw PRO software extended with the Seven Basic Tools of Quality solution from the Quality area of ConceptDraw Solution Park.
Check sheet example
Used Solutions
Quality
>
Seven Basic Tools of Quality - Fishbone Diagram

 Fishbone Diagrams
The Fishbone Diagrams solution extends ConceptDraw PRO v10 software with the ability to easily draw the Fishbone Diagrams (Ishikawa Diagrams) to clearly see the cause and effect analysis and also problem solving. The vector graphic diagrams produced using this solution can be used in whitepapers, presentations, datasheets, posters, and published technical material.
Total Quality Management Value

Basic Flowchart Symbols and Meaning


Scatter Chart Examples

- Check sheet for motor assembly | Seven Basic Tools of Quality ...
- Check Sheet In Quality Control
- Seven Basic Tools of Quality — Quality Control | Seven Basic Tools ...
- Probability Quality Control Tools | TQM Software — Build ...
- Design elements - Process flowchart | What Is Check Sheet Diagram
- Probability Quality Control Tools | Definition TQM Diagram | Quality ...
- Check sheet example
- Total Quality Management Value | Probability Quality Control Tools ...
- Seven Basic Tools of Quality | Electronic Components Sheet