This check sheet example was redesigned from the Wikimedia Commons file: Check sheet for motor assembly.svg. [commons.wikimedia.org/ wiki/ File:Check_ sheet_ for_ motor_ assembly.svg]
This file is licensed under the Creative Commons Attribution-Share Alike 3.0 Unported license. [creativecommons.org/ licenses/ by-sa/ 3.0/ deed.en]
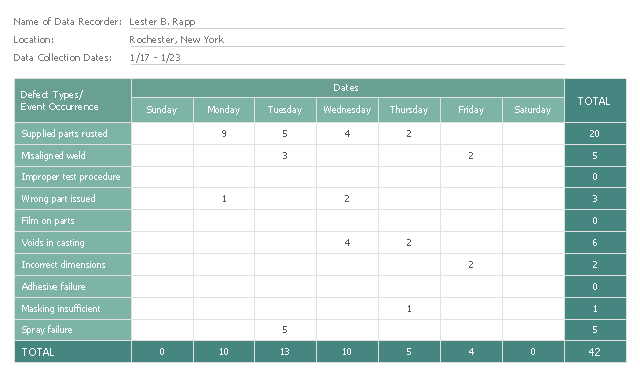
"The check sheet is a form (document) used to collect data in real time at the location where the data is generated. The data it captures can be quantitative or qualitative. When the information is quantitative, the check sheet is sometimes called a tally sheet.
The check sheet is one of the so-called Seven Basic Tools of Quality Control. ...
Kaoru Ishikawa identified five uses for check sheets in quality control:
- To check the shape of the probability distribution of a process
- To quantify defects by type
- To quantify defects by location
- To quantify defects by cause (machine, worker)
- To keep track of the completion of steps in a multistep procedure (in other words, as a checklist)" [. Wikipedia]
The example "Check sheet for motor assembly" was created using the ConceptDraw PRO software extended with the Seven Basic Tools of Quality solution from the Quality area of ConceptDraw Solution Park.
This file is licensed under the Creative Commons Attribution-Share Alike 3.0 Unported license. [creativecommons.org/ licenses/ by-sa/ 3.0/ deed.en]
"The check sheet is a form (document) used to collect data in real time at the location where the data is generated. The data it captures can be quantitative or qualitative. When the information is quantitative, the check sheet is sometimes called a tally sheet.
The check sheet is one of the so-called Seven Basic Tools of Quality Control. ...
Kaoru Ishikawa identified five uses for check sheets in quality control:
- To check the shape of the probability distribution of a process
- To quantify defects by type
- To quantify defects by location
- To quantify defects by cause (machine, worker)
- To keep track of the completion of steps in a multistep procedure (in other words, as a checklist)" [. Wikipedia]
The example "Check sheet for motor assembly" was created using the ConceptDraw PRO software extended with the Seven Basic Tools of Quality solution from the Quality area of ConceptDraw Solution Park.
Check sheet example
Used Solutions
Quality
>
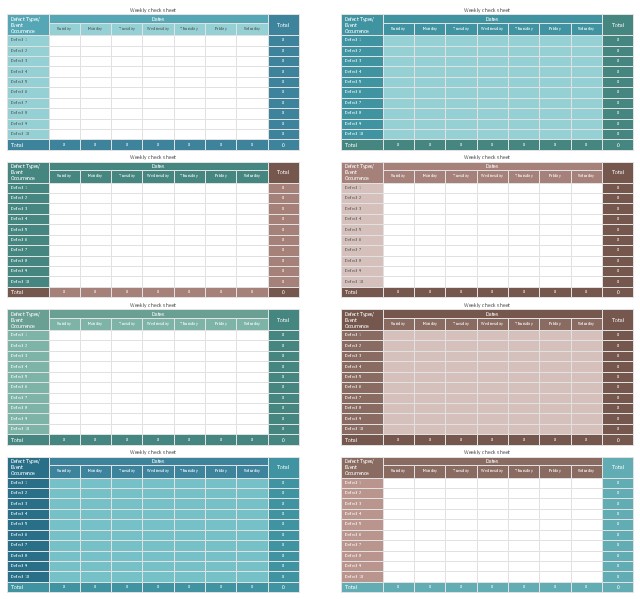
The vector stencils library "Check sheet" contains 8 templates of weekly check sheet.
Use it to design your check sheets with ConceptDraw PRO diagramming and vector drawing software.
"The check sheet is a form (document) used to collect data in real time at the location where the data is generated. The data it captures can be quantitative or qualitative. When the information is quantitative, the check sheet is sometimes called a tally sheet.
The check sheet is one of the so-called Seven Basic Tools of Quality Control." [Check sheet. Wikipedia]
The example of check sheet templates "Design elements - Check sheet" is included in the Seven Basic Tools of Quality solution from the Quality area of ConceptDraw Solution Park.
Weekly check sheet templates
 Seven Basic Tools of Quality
Manage quality control in the workplace, using fishbone diagrams, flowcharts, Pareto charts and histograms, provided by the Seven Basic Tools of Quality solution.
The vector stencils library "Process flowchart" contains 9 flow chart symbols.
Use it to design your process flowcharts with ConceptDraw PRO diagramming and vector drawing software.
"A flowchart is a type of diagram that represents an algorithm, workflow or process, showing the steps as boxes of various kinds, and their order by connecting them with arrows. ...
Kaoru Ishikawa defined the flowchart as one of the seven basic tools of quality control, next to the histogram, Pareto chart, check sheet, control chart, cause-and-effect diagram, and the scatter diagram. ...
Common alternative names include: flowchart, process flowchart, functional flowchart, process map, process chart, functional process chart, business process model, process model, process flow diagram, work flow diagram, business flow diagram. The terms "flowchart" and "flow chart" are used interchangeably." [Flowchart. Wikipedia]
The example of flow chart symbols "Design elements - Process flowchart" is included in the Seven Basic Tools of Quality solution from the Quality area of ConceptDraw Solution Park.
Process flowchart symbols

 Fishbone Diagrams
The Fishbone Diagrams solution extends ConceptDraw DIAGRAM software with the ability to easily draw the Fishbone Diagrams (Ishikawa Diagrams) to clearly see the cause and effect analysis and also problem solving. The vector graphic diagrams produced using this solution can be used in whitepapers, presentations, datasheets, posters, and published technical material.
 Business Package for Management
Package intended for professional who designing and documenting business processes, preparing business reports, plan projects and manage projects, manage organizational changes, prepare operational instructions, supervising specific department of an organization, workout customer service processes and prepare trainings for customer service personal, carry out a variety of duties to organize business workflow.
Bubble diagrams in Landscape Design with ConceptDraw DIAGRAM

- Check sheet for motor assembly | Seven Basic Tools of Quality ...
- Design elements - Check sheet | Seven Basic Tools of Quality ...
- Probability Quality Control Tools | Definition TQM Diagram | Quality ...
- Basic Quality Check Tool
- Probability Quality Control Tools | TQM Software — Build ...
- Total Quality Management Value | Probability Quality Control Tools ...
- Seven Basic Tools of Quality - Fishbone Diagram | Seven Basic ...
- How to Use ConceptDraw Infographic in Presentations, Documents ...
- Fishbone Diagrams | Seven Basic Tools of Quality | Seven Basic ...
- Quality Control Diagram
- Checklist Diagram Example
- Seven Basic Tools of Quality - Fishbone Diagram | Seven Basic ...
- Probability Quality Control Tools | Quality Control Chart Software ...
- Probability Quality Control Tools | Basic Flowchart Symbols and ...
- Basic Flowchart Symbols and Meaning | Probability Quality Control ...
- Quality Control Chart Software — ISO Flowcharting | Seven Basic ...
- Household Moving Checklist | Project management - Vector stencils ...
- Time Sheet Infographic
- Complete Chart Of All Drawing Symbols Of Quality Control
- Quality Control Chart Software — ISO Flowcharting | Probability ...