This HR infographics example was designed on the base of workflow diagram in the webpage "About Foreign Labor Certification" from the website of the U.S. Department of Labor.
"Hiring foreign workers for employment in the U.S. normally requires approval from several government agencies. ...
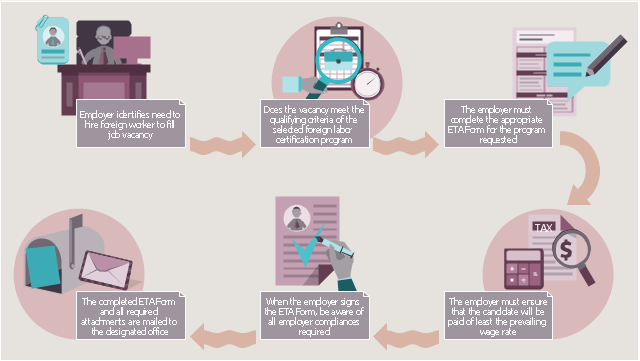
Although each foreign labor certification program is unique, there are similar requirements that the employer must complete prior to the issuance of a labor certification. In general, the employer will be required to complete these basic steps to obtain a labor certification:
1. The employer must ensure that the position meets the qualifying criteria for the requested program.
2. The employer must complete the ETA form designated for the requested program. This may include the form and any supporting documentation (e.g., job description, resume of the applicant, etc.).
3. The employer must ensure that the wage offered equals or exceeds the prevailing wage for the occupation in the area of intended employment.
4. The employer must ensure that the compliance issues effected upon receipt of a foreign labor certification are completely understood.
5. The completed ETA form is submitted to the designated Department of Labor office for the requested program (e.g., SWA, processing center or the national office).
6. The employer is notified of the determination of the Department of Labor."
[foreignlaborcert.doleta.gov/ about.cfm]
The HR infographics example "Foreign labor certification workflow" was created using the ConceptDraw PRO diagramming and vector drawing software extended with the HR Flowcharts solution from the Management area of ConceptDraw Solution Park.
"Hiring foreign workers for employment in the U.S. normally requires approval from several government agencies. ...
Although each foreign labor certification program is unique, there are similar requirements that the employer must complete prior to the issuance of a labor certification. In general, the employer will be required to complete these basic steps to obtain a labor certification:
1. The employer must ensure that the position meets the qualifying criteria for the requested program.
2. The employer must complete the ETA form designated for the requested program. This may include the form and any supporting documentation (e.g., job description, resume of the applicant, etc.).
3. The employer must ensure that the wage offered equals or exceeds the prevailing wage for the occupation in the area of intended employment.
4. The employer must ensure that the compliance issues effected upon receipt of a foreign labor certification are completely understood.
5. The completed ETA form is submitted to the designated Department of Labor office for the requested program (e.g., SWA, processing center or the national office).
6. The employer is notified of the determination of the Department of Labor."
[foreignlaborcert.doleta.gov/ about.cfm]
The HR infographics example "Foreign labor certification workflow" was created using the ConceptDraw PRO diagramming and vector drawing software extended with the HR Flowcharts solution from the Management area of ConceptDraw Solution Park.
HR workflow infographics
Tools to Create Your Own Infographics

 HR Flowcharts
Human resource management diagrams show recruitment models, the hiring process and human resource development of human resources.
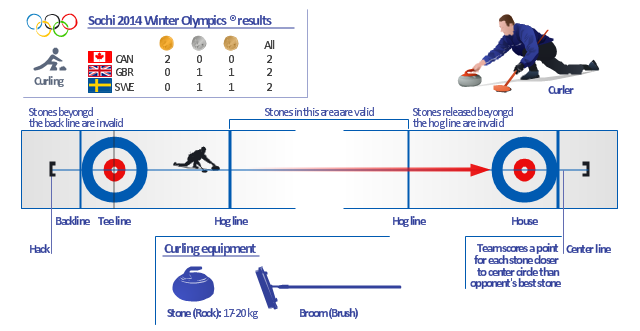
The example infographics "Curling sheet" shows Sochi 2014 Winter Olympics curling medal table, curing sheet scheme, curler and game equipment clipart images.
"The curling competition of the 2014 Winter Olympics was held at the Ice Cube Curling Center, nicknamed "the Ice Cube". It is the sixth time that curling was on the Olympic program. In both the men's and women's competitions, ten nations competed. These two events took place between 10–21 February 2014." [Curling at the 2014 Winter Olympics. Wikipedia]
The sport infographics example "Curling sheet" is created using the ConceptDraw PRO diagramming and vector drawing software extended with the Winter Sports solution from the Sport area of ConceptDraw Solution Park.
Sochi 2014 Winter Olympics curling results - Sport infographics
 Seven Basic Tools of Quality
Manage quality control in the workplace, using fishbone diagrams, flowcharts, Pareto charts and histograms, provided by the Seven Basic Tools of Quality solution.
 Android User Interface
The Android User Interface solution allows ConceptDraw PRO act as an Android UI design tool. Libraries and templates contain a variety of Android GUI elements to help users create images based on Android UI design.
Educational Technology Tools

 Value Stream Mapping
Value stream mapping solution extends ConceptDraw PRO software with templates, samples and vector stencils for drawing the Value Stream Maps (VSM) in lean manufacturing practice.
Process Flowchart


- Process Flowchart | Timesheet Infographic Chart
- Foreign labor certification workflow
- Curling sheet | Winter Sports | Curling Sheet Diagram
- Design Pictorial Infographics . Design Infographics | Time and clock ...
- Infographics On Workflow
- Time and clock pictograms - Vector stencils library | Design ...
- Time and clock pictograms - Vector stencils library | Football (Soccer ...
- HR workflow - Vector stencils library | Accounting flowcharts - Vector ...
- Foreign labor certification workflow | HR Flowcharts | HR workflow ...
- Time and clock pictograms - Vector stencils library | Time - Vector ...