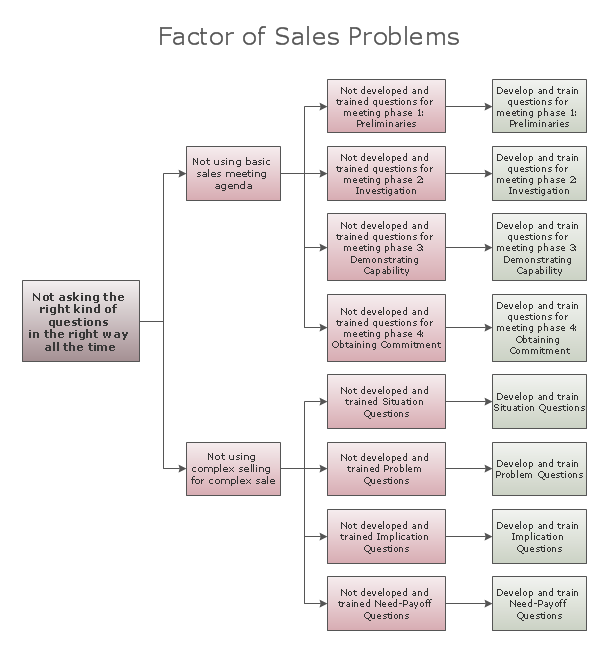
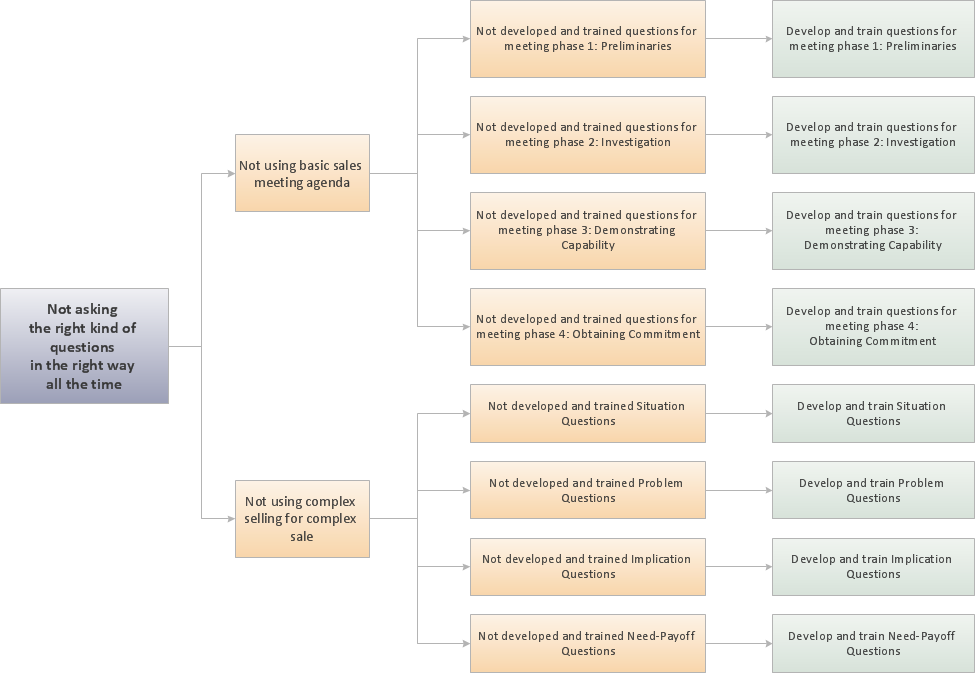
PROBLEM ANALYSIS. Root Cause Analysis Tree Diagram
Root Cause Analysis Tree Diagram. Use the Root Cause Diagram to perform visual root cause analysis. Root Cause Analysis Tree Diagram is constructed separately for each highly prioritized factor. The goal of this is to find the root causes for the factor and list possible corrective action. ConceptDraw Office suite is a software for problem analysis.
Root Cause Tree Diagram
Analyze the root causes of factors that influence the problem. A diagram is constructed separately for each high priority factor. Identify the root causes for a factor and then propose possible corrective actions. The diagram displays the structure of causes for a factor and possible corrective actions. The Root Cause Analysis Tree Diagram is used for further formulation of actions.
 Fault Tree Analysis Diagrams
This solution extends ConceptDraw PRO v9.5 or later with templates, fault tree analysis example, samples and a library of vector design elements for drawing FTA diagrams (or negative analytical trees), cause and effect diagrams and fault tree diagrams.
Communication Tool for Remote Project Management
Communication is the main challenge and the key success factor for remote project management. Communicating visually via Skype you bring all team and customers onto the one page. Remote Presentation for Skype solution for ConceptDraw MINDMAP helps communicate with remote team and customers in visual manner on wide range of issues. Using this solution for regular status meetings allows you to push your team on tasks and keep task statuses up to date.Fault Tree Diagram
ConceptDraw PRO diagramming and vector drawing software offers the Fault Tree Analysis Diagrams Solution from the Engineering Area of ConceptDraw Solution Park for quick and easy creating the Fault Tree Diagram of any degree of detailing.Project — Working With Tasks
A full-featured project management solution with all the necessary functions right at your fingertips. Generates an extensive variety of reports on project and task statuses. These videos provide a series of lessons that will enhance the understanding of all our users, from people just starting out with the software, through to expert users.Root Cause Tree Diagram
Analyze the root causes of factors that influence the problem. A diagram is constructed separately for each high priority factor. Identify the root causes for a factor and then list possible corrective action. The diagram displays the structure of causes for a factor and possible corrective actions. The Root Cause Tree Diagram is used for further formulation of actions.TQM Diagram Tool
The Total Quality Management Diagram solution helps you and your organization visualize business and industrial processes. Create Total Quality Management diagrams for business process with ConceptDraw software.Project —Task Trees and Dependencies
Users new to ConceptDraw PROJECT will find the Basic lessons an essential platform for familiarizing themselves with the program′s functions. This video lesson will teach you how to set up task trees and dependencies.CORRECTIVE ACTIONS PLANNING. Risk Diagram (PDPC)
Risk Diagram (PDPC) - ConceptDraw Office suite is a software for Risks Diagram making. This diagram identifies possible risks in accomplishing corrective actions. With the Risks Diagram, one analyzes each action separately in a tree of all actions and develops a preventive action in response of each potential obstacles or circumstances which may be a risk.
Fault Tree Analysis Example
Designing the Fault Tree Analysis (FTA) Diagrams first of all it is important to have a powerful software. ConceptDraw PRO diagramming and vector drawing software extended with Fault Tree Analysis Diagrams Solution from the Engineering Area is exactly what you need. It is also convenient to have professional looking Fault Tree Analysis example before the eyes, and it is excellent that this solution includes large collection of such examples.Cause and Effect Analysis
Cause and Effect Analysis - The Seven Management and Planning Tools is a tool for Cause and Effect Analysis that allows users to analyze the root causes for factors that influenced the problem. This diagram is constructed separately for each highly prioritized factor. The Diagram is then used for further formulation of potential actions.
Preventive Action
Preventive Action - ConceptDraw Office suite is a software for the Preventive Action making. The Seven Management and Planning Tools solution is a set of such tools for problems preventive actions via investigating of the core problem. Skilled use of these diagrams makes collaborative teamwork both more engaging and more effective.
Root Cause Analysis
The Seven Management and Planning Tools is a tool for Root Cause Analysis Tree Diagram drawing. This diagram is for Root Cause Analysis. Analyze the root causes for factors that influenced the problem. This diagram is constructed separately for each highly prioritized factor. The goal of this is to find the root causes for the factor and list possible corrective action.
 Seven Management and Planning Tools
Seven Management and Planning Tools solution extends ConceptDraw PRO and ConceptDraw MINDMAP with features, templates, samples and libraries of vector stencils for drawing management mind maps and diagrams.
- PROBLEM ANALYSIS. Root Cause Analysis Tree Diagram | How to ...
- Root Cause Tree Diagram | Communication Tool for Remote Project ...
- Fault Tree Analysis Software | Fault Tree Analysis Diagrams | Project ...
- PROBLEM ANALYSIS. Root Cause Analysis Tree Diagram | Project ...
- PROBLEM ANALYSIS. Root Cause Analysis Tree Diagram ...
- Basic Flowchart Symbols and Meaning | Root cause analysis tree ...
- Solution Tree Of Project Management
- PROBLEM ANALYSIS. Root Cause Analysis Tree Diagram
- Mind Map Tree Diagram
- Root cause analysis tree diagram - Template | PROBLEM ...
- Communication Tool for Remote Project Management | Affinity ...
- Decision tree diagram
- Fault Tree Analysis Diagrams | PROBLEM ANALYSIS. Root Cause ...
- How To Use Collaboration Tool in Project Management | Pyramid ...
- PROBLEM ANALYSIS. Root Cause Analysis Tree Diagram ...
- Seven Management and Planning Tools | PROBLEM ANALYSIS ...
- Tree Diagram Environmental Issues Science
- PROBLEM ANALYSIS. Root Cause Analysis Tree Diagram ...
- Project Management Decision Tree
- Time Management Tree Diagram


