SWOT Analysis
The SWOT Analysis provides information that is helpful in matching the firm's resources and capabilities to the competitive environment in which it operates. As such, it is instrument in strategy formulation and selection. SWOT analysis is a method of strategic planning which identifies the factors internal and external environment of the firm and divides them into 4 categories: strengths, weaknesses, opportunities and threats. The ConceptDraw DIAGRAM and MINDMAP software allow professional to make well-designed SWOT matrix in minutes.Swot Analysis Examples
SWOT Analysis solution from ConceptDraw Solution Park extends ConceptDraw DIAGRAM software with SWOT and TOWS matrix diagram examples and templates, that help identify and analyze Strengths, Weaknesses, Opportunities, and Threats.SWOT Analysis
The "SWOT Analysis" solution contains easy-to-use mind map templates that help identify Strengths, Weaknesses, Opportunities, and Threats, as well as outputs to ConceptDraw DIAGRAM for presenting analysis results.SWOT Analysis Tool for Small Business
SWOT analysis is a method of the making plan to evaluate the Strengths, Weaknesses, Opportunities, and Threats involved in a project. It involves specifying the objective of the project and identifying the internal and external causes for the accomplishing project goals.
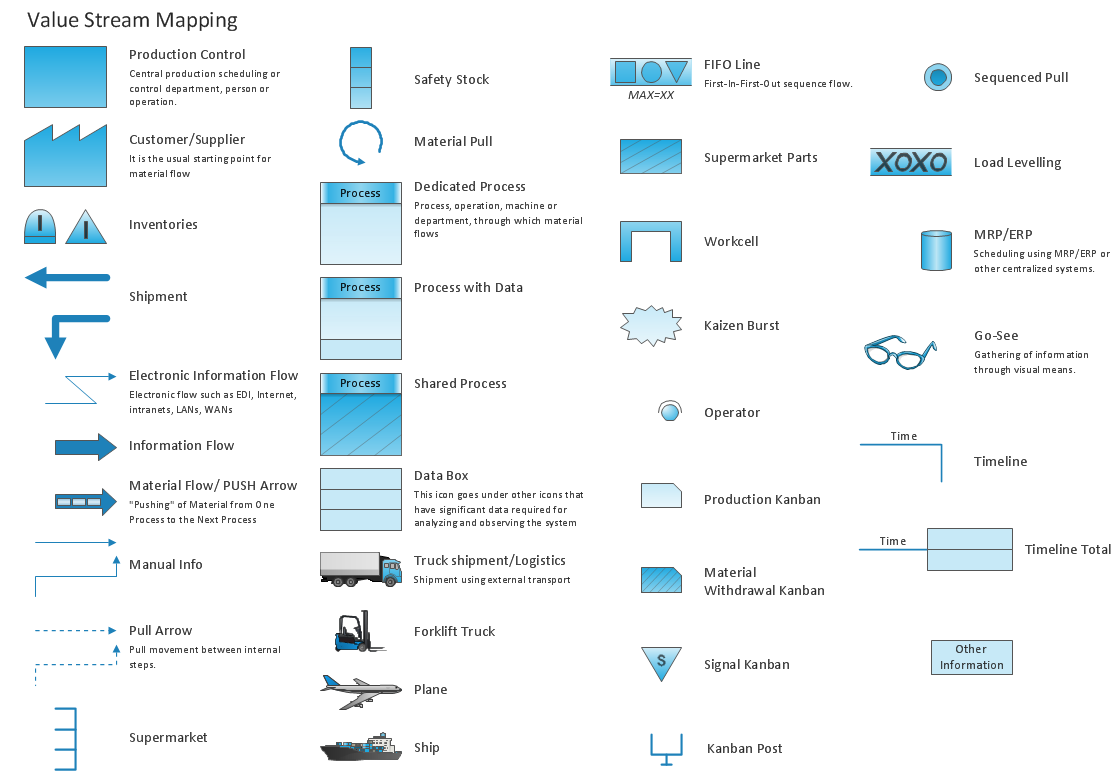
Value Stream Mapping - Design Elements
ConceptDraw DIAGRAM is a software for making Value Stream Mapping diagram with more than 10 library objects that are scalable vector images.Business Tools Perceptual Mapping
This sample shows the Perceptual map. It was created in ConceptDraw DIAGRAM diagramming and vector drawing software using the Matrices Solution from the Marketing area of ConceptDraw Solution Park.Perception Mapping helps organizations measure and transform all aspects of their business, people and culture. Perception Mapping allows to represent the complex relationships graphically, helps identify potential problems of the organization and make the best decisions.
Feature Comparison Chart Software
An example of marketing analysis diagram, can be used to analyse product market and define marketing strategy.This sample shows the Feature Comparison Chart of the digital scouting cameras. It can be useful for digital cameras production field, marketing, sales, etc.
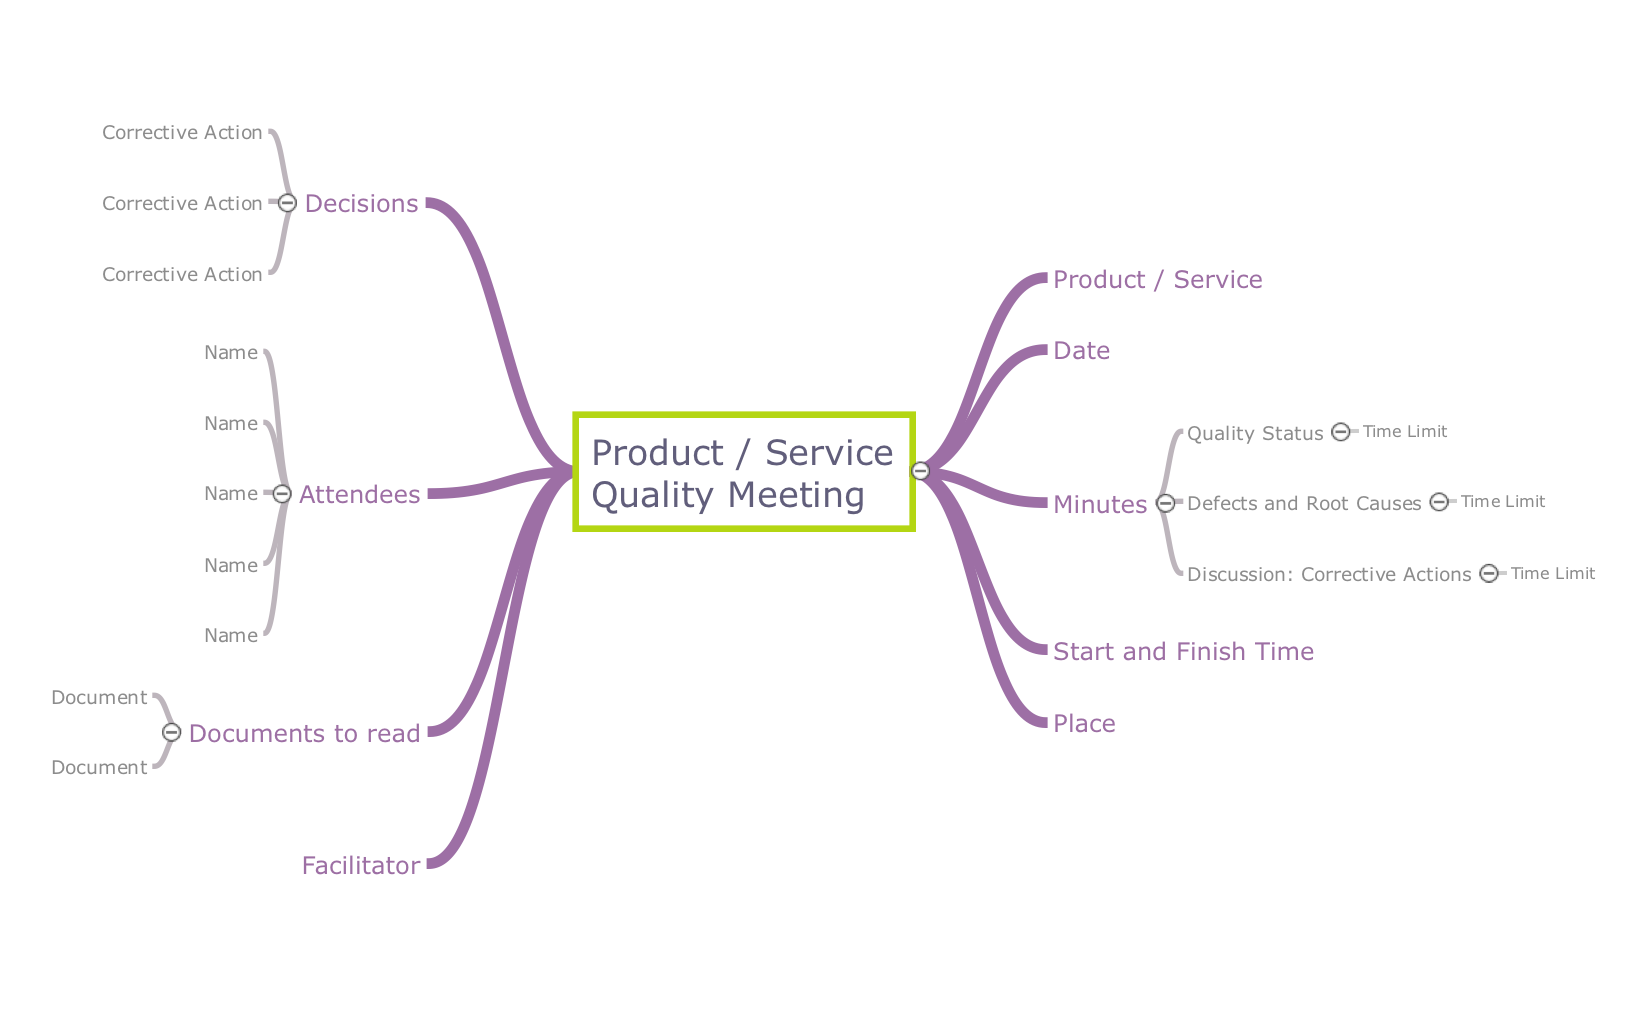
Quality visualization in your company
Using ConceptDraw quality mind maps is a perfect addition to quality visualization in your company.Competitor Analysis
Competitor analysis is a first and obligatory step in elaboration the proper corporate marketing strategy and creating sustainable competitive advantage. Use powerful opportunities of numerous solutions from ConceptDraw Solution Park for designing illustrative diagrams, charts, matrices which are necessary for effective competitor analysis.Computer Hardware - Reseller Business Plan
A more detailed mind map of a business plan for a computer hardware reseller.IDEF1 standard
Use Case Diagrams technology. Using visual graphical objects IDEF1 standard allows to model information interrelations.Cause and Effect Analysis - Fishbone Diagrams for Problem Solving
Fishbone diagram is a powerful tool used for solving business problems and obstacles. ConceptDraw DIAGRAM software extended with Fishbone Diagrams solution from the Management area of ConceptDraw Solution Park is a helpful tool for cause and effect analysis. It gives the ability to easy identify many possible causes and factors which cause the effects and to draw Fishbone Diagrams for problem solving.Using Fishbone Diagrams for Problem Solving
Problems are obstacles and challenges that one should overcome to reach the goal. They are an inseparable part of any business, and the success of an enterprise often depends on ability to solve all problems effectively. The process of problem solving often uses rational approach, helping to find a suitable solution.Using Fishbone Diagrams for Problem Solving is a productive and illustrative tool to identify the most important factors causing the trouble. ConceptDraw DIAGRAM extended with Fishbone Diagrams solution from the Management area of ConceptDraw Solution Park is a powerful tool for problem solving with Fishbone Ishikawa diagram graphic method.
Basic Audit Flowchart. Flowchart Examples
This sample shows the Audit Process Flowchart. It was created in ConceptDraw DIAGRAM diagramming and vector drawing software using the Flowcharts solution from the Diagrams area of ConceptDraw Solution Park.The Audit Flowcharts are widely used in the financial management, accounting, money management and in many others fields.
ConceptDraw MINDMAP : Brainstorming, Mind Mapping for macOS and Windows
ConceptDraw MINDMAP is a powerful business and personal productivity software application that provides visual organization and access to information for individuals and organizations.- Swot Analysis Of Production Company
- Industry Production Department Swot Analysis Example
- SWOT Analysis | SWOT Analysis Software | SWOT Analysis Solution ...
- Swot Analysis Of Production Manager
- SWOT Matrix Template | SWOT and TOWS Matrix Diagrams | SWOT ...
- SWOT Analysis | Swot Analysis Examples | Types of Flowchart ...
- SWOT Analysis | SWOT analysis matrix diagram templates | Pie ...
- SWOT Analysis | SWOT Analysis Software | SWOT Analysis Solution ...
- SWOT Analysis | Matrix Organization Structure | Business Structure ...
- SWOT Analysis
- Cause and Effect Analysis - Fishbone Diagrams for Problem Solving ...
- Swot Analysis For It Company
- Swot Analysis For A Landscaping Company
- SWOT Analysis | SWOT Matrix | Flowchart of Products. Flowchart ...
- TQM Diagram Tool | SWOT Analysis Software | Total Quality ...
- Probability Quality Control Tools | SWOT Analysis Solution - Strategy ...
- Feature Comparison Chart Software | SWOT analysis matrix ...
- Quality Mind Maps - samples and templates | SWOT Matrix Template ...
- Process Flowchart | Value stream map - Template | SWOT Analysis ...
- SWOT Analysis
- ERD | Entity Relationship Diagrams, ERD Software for Mac and Win
- Flowchart | Basic Flowchart Symbols and Meaning
- Flowchart | Flowchart Design - Symbols, Shapes, Stencils and Icons
- Flowchart | Flow Chart Symbols
- Electrical | Electrical Drawing - Wiring and Circuits Schematics
- Flowchart | Common Flowchart Symbols