Create a Presentation Using a Design Template
The intuitive interface of ConceptDraw MINDMAP and the Functional Tools overview below will guide you in creating and demonstrating powerful mind map presentations using template.An advanced tool allows you effectively generate, change, and update your presentation.
HelpDesk
How to Make PowerPoint Presentation of Data Driven Infographics
ConceptDraw DIAGRAM can be used as a tool for creating data-driven infographics. It allows you to draw data driven using the special templates and vector stencils libraries. ConceptDraw DIAGRAM allows you to make an MS PowerPoint Presentation from your Data-driven infographics in a few simple steps.Create Captivating Presentations Easily
When you prepare professional-looking presentation, you need to use ConceptDraw MINDMAP software for the amazing result.HelpDesk
How to Create Data-Driven Infographics
Data-driven infographics are used in wildly disparate areas of business and commerce. To make effective Data-driven infographics, it's useful to have a wide variety of graphical elements — icons, clipart, stencils, charts, and graphs — to illustrate your diagram. ConceptDraw Data-driven Infographics solution provides all the tools you need to present data as described by this article — as well as the charts mentioned previously, you can find histograms, divided bar charts, ring charts, line graphs, and area charts — meaning you can find the perfect medium for displaying a certain type of data. It allows you to draw data-driven infographics quickly and easily using the special templates and vector stencils libraries. It can be used to quickly communicate a message, to simplify the presentation of large amounts of data, to see data patterns and relationships, and to monitor changes in variables over time.How To Make an Effective PowerPoint Presentation
ConceptDraw MINDMAP is an advanced tool for making an effective PowerPoint presentation.HelpDesk
How to Create Management Infographics
Management might want to communicate a basic workflow for each division of the company, visualize business strategy and decision processes, or display a certain business training concept. In this case, an infographic can be more text heavy and use illustrations to establish a timeline, process, or step-by-step sequence of events.ConceptDraw DIAGRAM can be used as a tool for creating management infographics. It allows you to draw infographics quickly and easily using the special templates and vector stencils libraries. Infographics can be used to quickly communicate a message, to simplify the presentation of large amounts of data, to see data patterns and relationships, and to monitor changes in variables over time. It can contain bar graphs, pie charts, histograms, line charts, e.t.c.
HelpDesk
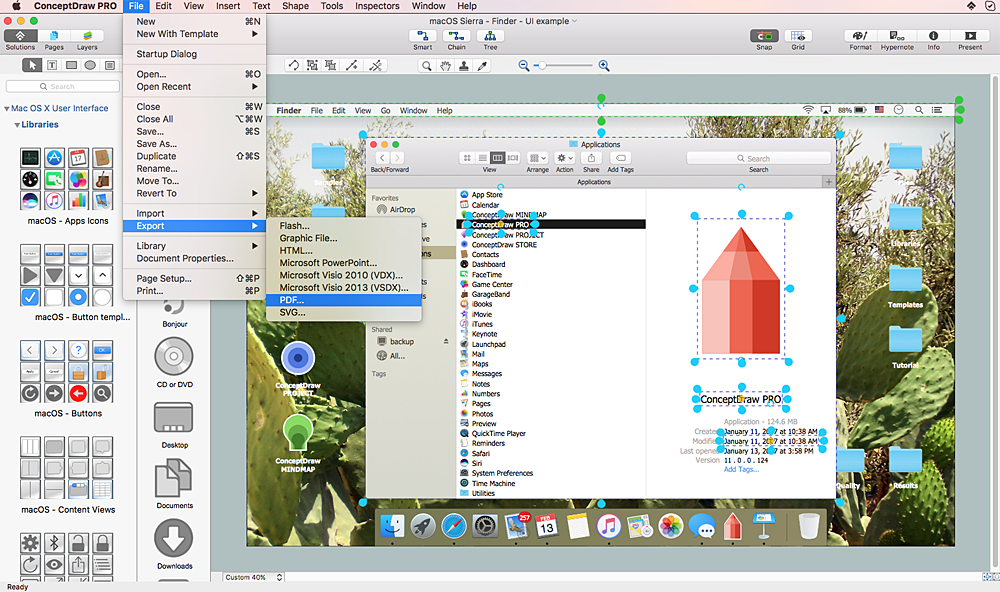
How to Design a Mockup of Apple macOS Sierra GUI
Since that first Macintosh, Apple has always developed and used their own hardware specific operating system. The fundamental style and layout of the Mac OS X user interface have remained largely in place since the earliest versions, but there have been obvious aesthetic enhancements, and elements of icon redesign to match branding across devices. To design an effective user interface, graphic designers will create visual GUI prototypes, that focus on maximizing the user experience. Uses Interface prototyping is much convenient when you can work through a diagram similar to the OS X design. ConceptDraw DIAGRAM allows you to develop Apple OS X User Interface (UI) prototypes using the special templates and vector libraries of the specific user interface elements. ConceptDraw Mac OS X UI solution offers libraries containing the distinct Mac app icons, menu bar graphics, glyph elements and other Mac OS X features — everything necessary to create a high standard, professional UI graphic design.HelpDesk
How to Create a Timeline Diagram
A Timeline is a chart which displays a project plan schedule in chronological order. A Timeline is used in project management to depict project milestones and visualize project phases and show project progress. The graphic form of a timeline makes it easy to understand critical project milestones, such as the progress of a project schedule. Timelines are particularly useful for project scheduling or project management when accompanied with a Gantt chart. It captures the main of what the project will accomplish and how it will be done. making a project timeline is one of the most important skills a project manager needs have. Making comprehensive, accurate timelines allows you getting every project off in the best way. ConceptDraw DIAGRAM allows you to draw a timeline chart using a special library.Pie Chart Examples and Templates
A pie chart or a circle graph is a circular chart divided into sectors, illustrating numerical proportion. In a pie chart, the arc length of each sector and consequently its central angle and area, is proportional to the quantity it represents.Pie chart examples and templates created using ConceptDraw DIAGRAM software helps you get closer with pie charts and find pie chart examples suite your needs.
- Draw A Pie Chart Showing Different Gases And Their Percentage In
- ConceptDraw | Press Releases
- Evacuation Route Map Template
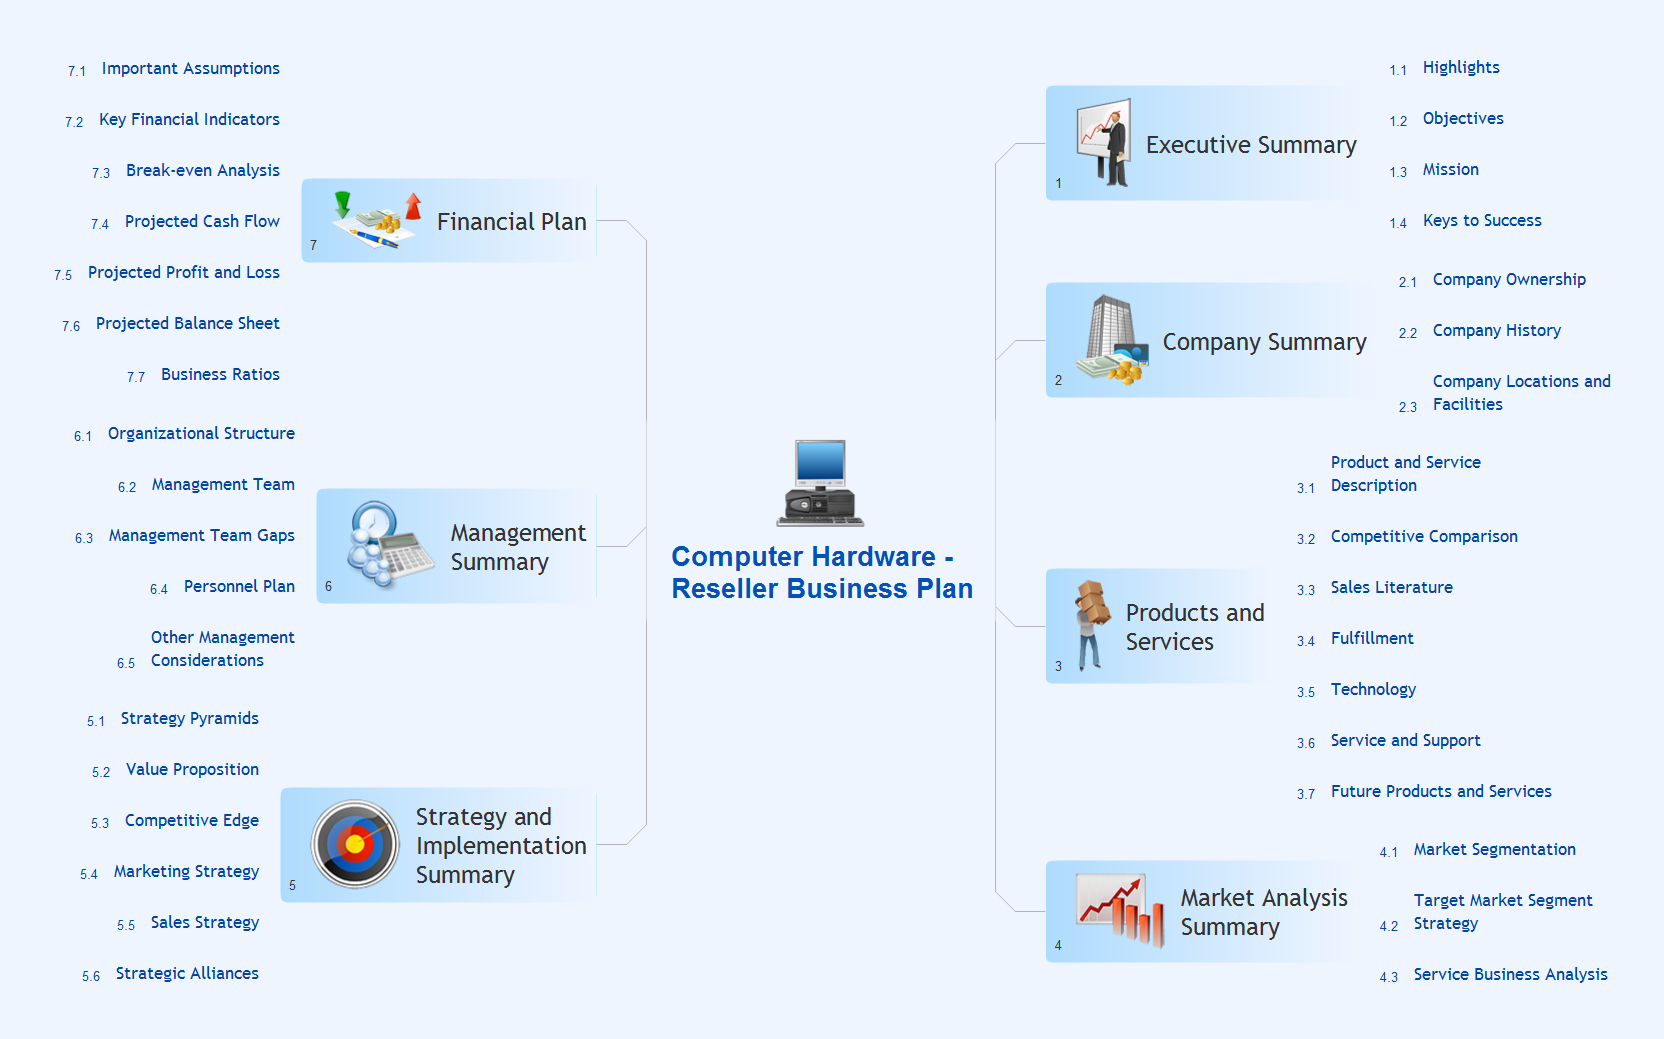
- How to Create a PowerPoint ® Presentation from a Mind Map | Why ...
- Atmosphere air composition | Percentage Pie Chart. Pie Chart ...
- SWOT and TOWS Matrix Diagrams | SWOT Template | Pia Diagram
- Atmosphere air composition | Percentage Pie Chart. Pie Chart ...
- Percentage Pie Chart. Pie Chart Examples | Exploded pie chart ...
- New CRM Center Dashboard Solution for ConceptDraw PRO
- Pie Graph Worksheets | Percentage Pie Chart. Pie Chart Examples ...
- ERD | Entity Relationship Diagrams, ERD Software for Mac and Win
- Flowchart | Basic Flowchart Symbols and Meaning
- Flowchart | Flowchart Design - Symbols, Shapes, Stencils and Icons
- Flowchart | Flow Chart Symbols
- Electrical | Electrical Drawing - Wiring and Circuits Schematics
- Flowchart | Common Flowchart Symbols