HelpDesk
How to Draw a Pictorial Chart in ConceptDraw PRO

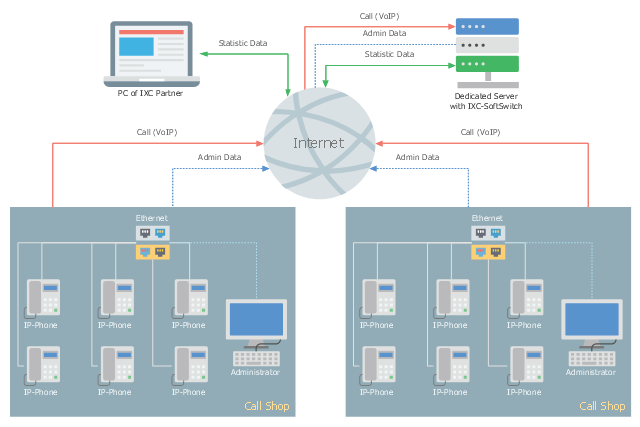
This telecom diagram sample illustrates the call shop solution. It was designed on the base of the Wikimedia Commons file: Call shops.jpg.
[commons.wikimedia.org/ wiki/ File:Call_ shops.jpg]
This file is licensed under the Creative Commons Attribution-Share Alike 3.0 Unported license. [creativecommons.org/ licenses/ by-sa/ 3.0/ deed.en]
"A call shop is a business providing on-site access to telephones for long-distance calling in countries without widespread home long-distance service. Calls may be prepaid or postpaid." [Call shop. Wikipedia]
The telecommunication diagram example "Call shop solution" was created using the ConceptDraw PRO diagramming and vector drawing software extended with the Computers and Communications solution from the Illustration area of ConceptDraw Solution Park.
Telecom diagram
Design Pictorial Infographics. Design Infographics

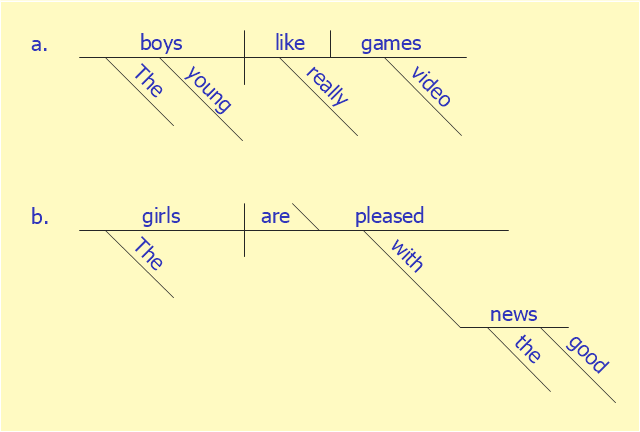
This sentence diagram example was redesigned from the Wikipedia file: Examples of Reed-Kellogg diagrams.jpg.
[en.wikipedia.org/ wiki/ File:Examples_ of_ Reed-Kellogg_ diagrams.jpg]
This file is licensed under the Creative Commons Attribution-Share Alike 3.0 Unported license. [creativecommons.org/ licenses/ by-sa/ 3.0/ deed.en]
"Most methods of diagramming in pedagogy are based on the work of Alonzo Reed and Brainerd Kellogg in their book Higher Lessons in English, first published in 1877, though the method has been updated with recent understanding of grammar. Reed and Kellogg were preceded, and their work probably informed, by W. S. Clark, who published his "balloon" method of depicting grammar in his 1847 book A Practical Grammar: In Which Words, Phrases & Sentences are Classified According to Their Offices and Their Various Relationships to Each Another.
Some schoolteachers continue to use the Reed-Kellogg system in teaching grammar, but others have discouraged it in favor of more modern tree diagrams. However, these modern tree structures draw on techniques that were already present in Reed-Kellogg diagrams. Reed and Kellogg defend their system in the preface to their grammar:
The Objections to the Diagram. - The fact that the pictorial diagram groups the parts of a sentence according to their offices and relations, and not in the order of speech, has been spoken of as a fault. It is, on the contrary, a merit, for it teaches the pupil to look through the literary order and discover the logical order. He thus learns what the literary order really is, and sees that this may be varied indefinitely, so long as the logical relations are kept clear.
The assertion that correct diagrams can be made mechanically is not borne out by the facts. It is easier to avoid precision in oral analysis than in written. The diagram drives the pupil to a most searching examination of the sentence, brings him face to face with every difficulty, and compels a decision on every point.
These statements bear witness to the fact that Reed-Kellogg diagrams abstract away from actual word order in order to focus more intently on how words in sentences function and relate to each other." [Sentence diagram. Wikipedia]
The examples of Reed-Kellogg diagrams was created using the ConceptDraw PRO diagramming and vector drawing software extended with the Language Learning solution from the Science and Education area of ConceptDraw Solution Park.
Sentence diagram
"Most methods of diagramming in pedagogy are based on the work of Alonzo Reed and Brainerd Kellogg in their book Higher Lessons in English, first published in 1877, though the method has been updated with recent understanding of grammar. ...
Some schoolteachers continue to use the Reed-Kellogg system in teaching grammar, but others have discouraged it in favor of more modern tree diagrams. However, these modern tree structures draw on techniques that were already present in Reed-Kellogg diagrams. Reed and Kellogg defend their system in the preface to their grammar:
The Objections to the Diagram.--The fact that the pictorial diagram groups the parts of a sentence according to their offices and relations, and not in the order of speech, has been spoken of as a fault. It is, on the contrary, a merit, for it teaches the pupil to look through the literary order and discover the logical order. He thus learns what the literary order really is, and sees that this may be varied indefinitely, so long as the logical relations are kept clear.
The assertion that correct diagrams can be made mechanically is not borne out by the facts. It is easier to avoid precision in oral analysis than in written. The diagram drives the pupil to a most searching examination of the sentence, brings him face to face with every difficulty, and compels a decision on every point.
... Reed-Kellogg diagrams abstract away from actual word order in order to focus more intently on how words in sentences function and relate to each other.
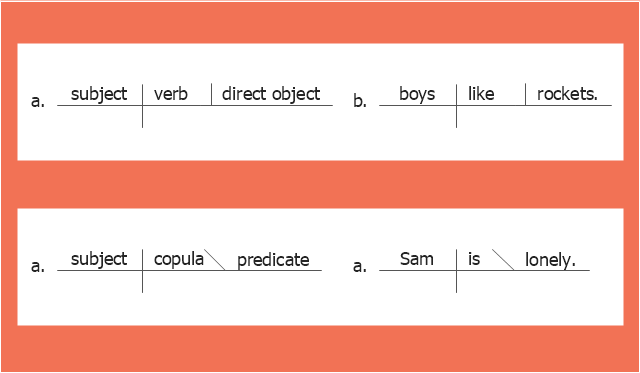
The Reed-Kellogg System. Simple sentences in the Reed-Kellogg system are diagrammed in accordance with the ... basic schemata" shown in this diagram example. [Sentence diagram. Wikipedia]
The example "The Reed-Kellogg system - Basic schemata" was created using the ConceptDraw PRO diagramming and vector drawing software extended with the Language Learning solution from the Science and Education area of ConceptDraw Solution Park.
Some schoolteachers continue to use the Reed-Kellogg system in teaching grammar, but others have discouraged it in favor of more modern tree diagrams. However, these modern tree structures draw on techniques that were already present in Reed-Kellogg diagrams. Reed and Kellogg defend their system in the preface to their grammar:
The Objections to the Diagram.--The fact that the pictorial diagram groups the parts of a sentence according to their offices and relations, and not in the order of speech, has been spoken of as a fault. It is, on the contrary, a merit, for it teaches the pupil to look through the literary order and discover the logical order. He thus learns what the literary order really is, and sees that this may be varied indefinitely, so long as the logical relations are kept clear.
The assertion that correct diagrams can be made mechanically is not borne out by the facts. It is easier to avoid precision in oral analysis than in written. The diagram drives the pupil to a most searching examination of the sentence, brings him face to face with every difficulty, and compels a decision on every point.
... Reed-Kellogg diagrams abstract away from actual word order in order to focus more intently on how words in sentences function and relate to each other.
The Reed-Kellogg System. Simple sentences in the Reed-Kellogg system are diagrammed in accordance with the ... basic schemata" shown in this diagram example. [Sentence diagram. Wikipedia]
The example "The Reed-Kellogg system - Basic schemata" was created using the ConceptDraw PRO diagramming and vector drawing software extended with the Language Learning solution from the Science and Education area of ConceptDraw Solution Park.
Sentence diagram
Sample Pictorial Chart. Sample Infographics
")
Work Process

Sentence Diagram

Network Diagram Software LAN Network Diagrams & Diagrams for LAN Physical Office Network Diagrams


Process Flowchart


Drawing Workflow Diagrams

 IDEF Business Process Diagrams
Use the IDEF Business Process Diagrams solution to create effective database designs and object-oriented designs, following the integration definition methodology.
Workflow Flowchart Symbols

Workflow Process Example

- How to Draw a Pictorial Chart in ConceptDraw PRO | How to Draw ...
- Pictorial Diagram Representation Of Flowchart
- Electrical Engineering | Pictorial Diagram Of Analog Communication ...
- Pictorial Diagram Representation Of Flow Charts
- Pictorial Diagram Of Any Telecommunication System
- Pictorial Diagram Of Truck
- Home area networks (HAN). Computer and Network Examples ...
- How to Draw a Pictorial Chart in ConceptDraw PRO | Sample ...
- Pictorial Diagram Of An Organizational Chart Of An Office
- How to Create a CCTV Diagram in ConceptDraw PRO | Pictorial ...
- Drawing Workflow Diagrams | Workflow Process Example | Work ...
- How To Make A Pictorial Diagram
- Example Of Pictorial Diagram
- Wiring Diagrams with ConceptDraw PRO | Electrical Drawing ...
- Pictorial Diagram Of Flowchart
- 5 Examples Of Pictorial Diagram
- Free-body diagram | Pictorial Explanation Of Inclined Plane
- Pictorial Diagram Of Communication System
- Design Pictorial Infographics. Design Infographics | Diagram ...
- How to Draw a Pictorial Chart in ConceptDraw PRO | Process ...