Design Pictorial Infographics. Design Infographics
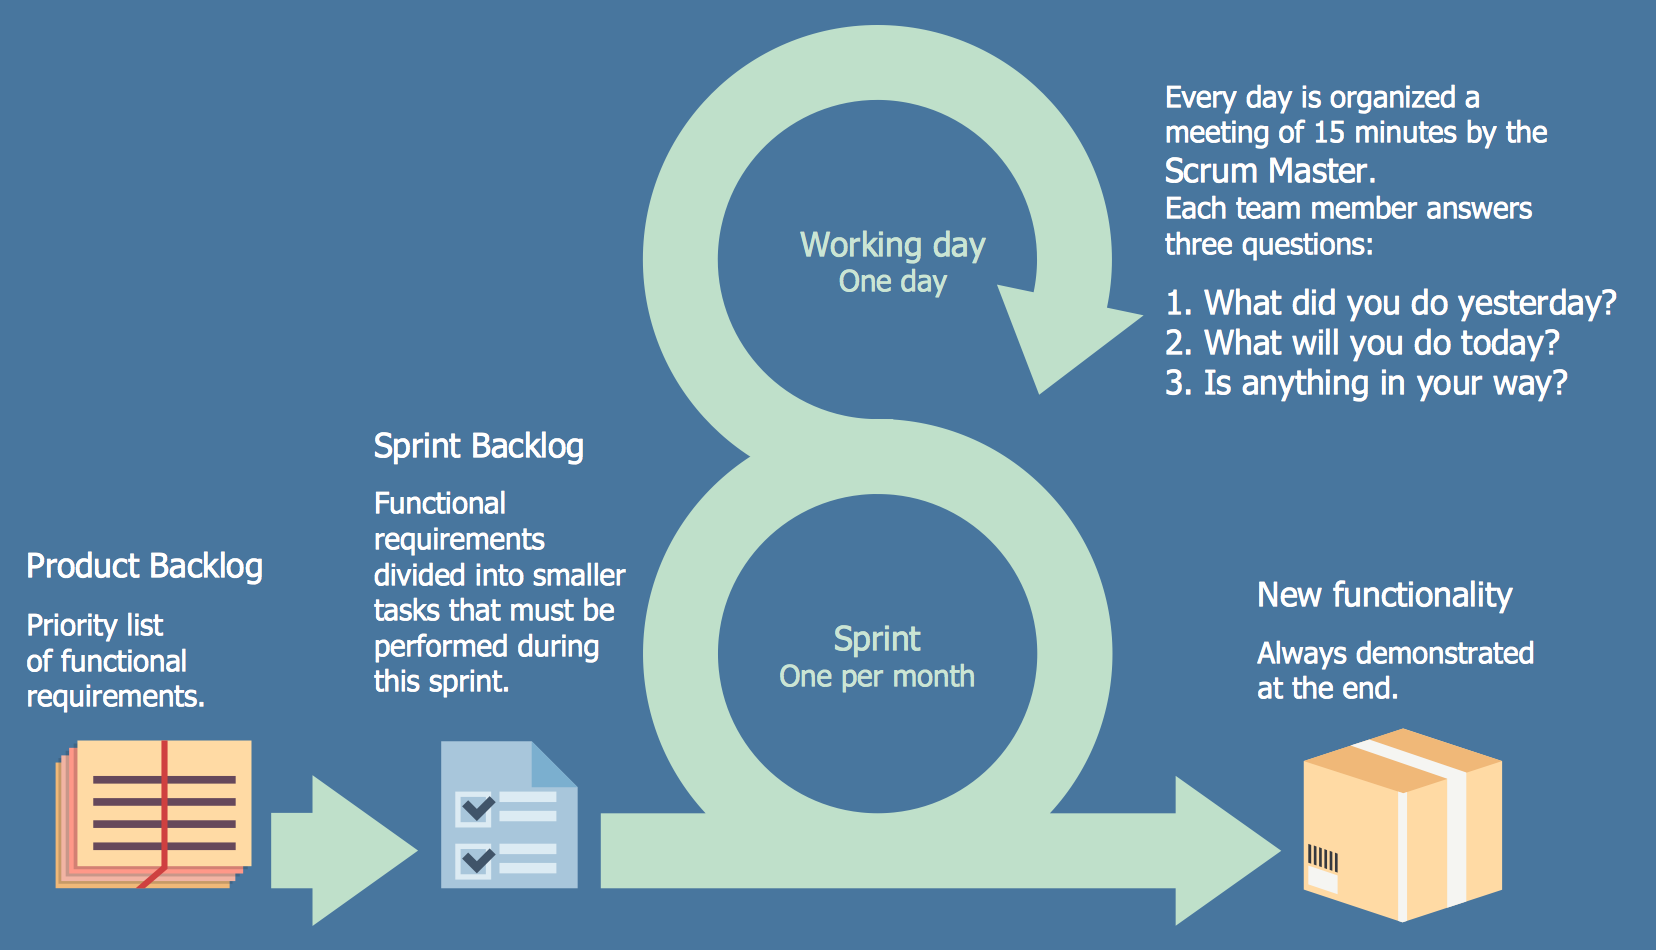
In the course of recent decades data visualization went through significant development and has become an indispensable tool of journalism, business intelligence and science. The way visual information may be conveyed is not limited simply to static or dynamic representation, it can also be interactive. Infographics can be conditionally divided into several general levels. Primarily, this is level of visualization of information, its interpretation and association on any ground. Second level can be defined as a visualization of knowledge, depiction of thoughts and ideas in the form of images or diagrams. Finally, the level of data visualization, which processes data arrays in charts, enabling the information to be more clearly perceived. You can also identify the main approaches to the creation of infographics: exploratory and narrative. Exploratory method insists on minimalist design in favor of data precision without unnecessary details and is common for scientific researches and anaScrum workflow
ConceptDraw PRO diagramming and vector drawing software extended with unique SCRUM Workflow solution from the Project Management area of ConceptDraw Solution Park allows fast and easy design professional-looking Scrum Workflow Diagrams and Scrum workflow scheme for projects required when working on projects and managing them, when developing software with cutting-edge Agile methodologies.Pictures of Vegetables
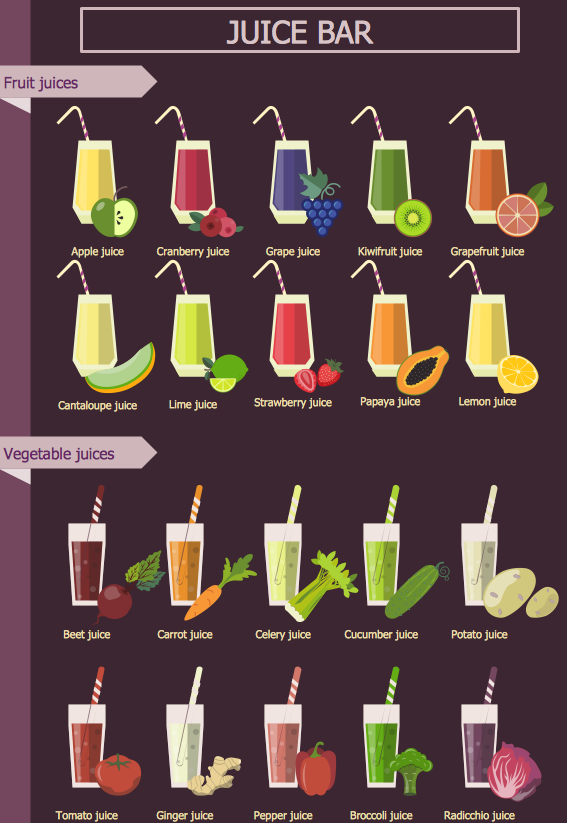
Designing of food images, fruit art illustrations, pictures of vegetables, and many other food and cafe related images and infographics has never been easier than it is now with ConceptDraw PRO software. ConceptDraw PRO diagramming and vector drawing software extended with Food Court solution from the Food and Beverage area of ConceptDraw Solution Park is perfect food pictures design software.
 ConceptDraw Solution Park
ConceptDraw Solution Park collects graphic extensions, examples and learning materials
Network Diagram Software LAN Network Diagrams & Diagrams for LAN Physical Office Network Diagrams
Physical LAN Diagrams illustrate the communication schemes of Local Area Networks, the physical network connection of computers and networks arrangement on the small areas - at homes, offices, and other buildings. ConceptDraw PRO is a perfect network diagramming software with samples and examples of WAN and LAN Diagrams, templates and collection of network components libraries. Computer Network Diagrams Solution for ConceptDraw PRO Mac and Windows is ideal for IT professionals, network engineers and network designers who need to visualize network architecture, to document LANs physical structure and arrangement, to draw Local Area Network (LAN) diagrams and schematics, WAN diagrams, physical office network diagrams and topologies, wiring drawings, etc. You can design all them easy using the predesigned vector objects of computers and computer network devices, hardware devices, peripheral devices, external digital devices, internet and logical symbols, and many other stencils from the Computer Network Diagrams libraries. ConceptDraw PRO offers a powerful and easy-to-use solution for those who looking for a Visio alternative for Mac. It is a world-class diagramming platform with dynamic presentation power.
 Chemical and Process Engineering
This chemical engineering solution extends ConceptDraw PRO v.9.5 (or later) with process flow diagram symbols, samples, process diagrams templates and libraries of design elements for creating process and instrumentation diagrams, block flow diagrams (BFD
 Computer Network Diagrams
Computer Network Diagrams solution extends ConceptDraw PRO software with samples, templates and libraries of vector icons and objects of computer network devices and network components to help you create professional-looking Computer Network Diagrams, to plan simple home networks and complex computer network configurations for large buildings, to represent their schemes in a comprehensible graphical view, to document computer networks configurations, to depict the interactions between network's components, the used protocols and topologies, to represent physical and logical network structures, to compare visually different topologies and to depict their combinations, to represent in details the network structure with help of schemes, to study and analyze the network configurations, to communicate effectively to engineers, stakeholders and end-users, to track network working and troubleshoot, if necessary.
 Bubble Diagrams
Bubble diagrams have enjoyed great success in software engineering, architecture, economics, medicine, landscape design, scientific and educational process, for ideas organization during brainstorming, for making business illustrations, presentations, planning, design, and strategy development. They are popular because of their simplicity and their powerful visual communication attributes.
Types of Flowcharts
A Flowchart is a graphical representation of process, algorithm, workflow or step-by-step solution of the problem. It shows the steps as boxes of various kinds and connects them by arrows in a defined order depicting a flow. There are twelve main Flowchart types: Basic Flowchart, Business Process Modeling Diagram (BPMN), Cross Functional Flowchart, Data Flow Diagram (DFD), IDEF (Integrated DEFinition) Flowchart, Event-driven Process Chain (EPC) Diagram, Influence Diagram (ID), Swimlane Flowchart, Process Flow Diagram (PFD), Specification and Description Language (SDL) Diagram, Value Stream Mapping, Workflow Diagram. Using the Flowcharts solution from the Diagrams area of ConceptDraw Solution Park you can easy and quickly design a Flowchart of any of these types. This solution offers a lot of special predesigned vector symbols for each of these widely used notations. They will make the drawing process of Flowcharts much easier than ever. Pay also attention for the included collection of ready Flowchart examples, samples and quick-start templates. This is business process improvement tools. If you are looking for MS Visio for your Mac, then you are out of luck, because it hasn't been released yet. However, you can use Visio alternatives that can successfully replace its functions. ConceptDraw PRO is an alternative to MS Visio for Mac that provides powerful features and intuitive user interface for the same.
Basic Flowchart Images. Flowchart Examples
This sample was created in ConceptDraw PRO diagramming and vector drawing software using the Flowcharts solution from the Diagrams area of ConceptDraw Solution Park. This sample shows the Flowchart that displays the procedures of 2PP (two-party preferred) voting and counting the voters. The two-party-preferred vote is the result of the elections that was distributed to the final two parties.
 Plumbing and Piping Plans
Plumbing and Piping Plans solution extends ConceptDraw PRO v10.2.2 software with samples, templates and libraries of pipes, plumbing, and valves design elements for developing of water and plumbing systems, and for drawing Plumbing plan, Piping plan, PVC Pipe plan, PVC Pipe furniture plan, Plumbing layout plan, Plumbing floor plan, Half pipe plans, Pipe bender plans.
 Circle-Spoke Diagrams
Examples of subject areas that are well suited to this approach are marketing, business, products promotion, process modeling, market, resource, time, and cost analysis. Circle-Spoke Diagrams are successfully used in presentations, conferences, management documents, magazines, reportages, reviews, reports, TV, and social media.
 Event-driven Process Chain Diagrams
Event-driven Process Chain (EPC) Diagram is a type of flowchart widely used for modeling in business engineering and reengineering, business process improvement, and analysis. EPC method was developed within the Architecture of Integrated Information Systems (ARIS) framework.
 Composition Dashboard
Composition dashboard solution extends ConceptDraw PRO software with templates, samples and vector stencils library with charts and indicators for drawing visual dashboards showing data composition.
 Scrum Workflow
The Scrum Workflow Solution extends the capabilities of ConceptDraw PRO 10 with a large collection of professionally-designed samples and a selection of ready-to-use scrum design elements: scrum diagrams and arrows, scrum icons of people, artifacts, workflow, workspace and other colorful scrum clipart, and also scrum charts.
- How To Make Pictorial Chart On Components Of Food
- Make A Pictorial Chart On The Components Of Food
- A Flow Chart On Food And Their Components With Examples And ...
- Image Of Balance Diet Chart For Drawing With Label
- Pyramid Diagram | Pyramid Diagram | Process Flowchart | Chart Of ...
- Food trailer water supply | Flow chart Example. Warehouse ...
- Design Pictorial Infographics. Design Infographics | Flow chart ...
- Flow chart Example. Warehouse Flowchart | Food security ...
- Example of DFD for Online Store (Data Flow Diagram ) DFD ...
- Food Truck Menu Template
- Bio Flowchart | Flowchart Examples | Online Flow Chart | Flowchart ...
- Flow chart Example. Warehouse Flowchart | Process Engineering ...
- How to Draw Pictorial Chart . How to Use Infograms | Pictorial Chart ...
- Chart Of Gasees
- Arrow Vector Pictures
- Building Networks | Top 5 Android Flow Chart Apps | Picture graphs ...
- Basic Flowchart Symbols and Meaning | Data Flow Diagram | How ...
- Spatial infographics Design Elements: Continental Map | Map ...
- Example Of Food Complex Work Flow Chart
- Pictorial Flow Chart For Topology


