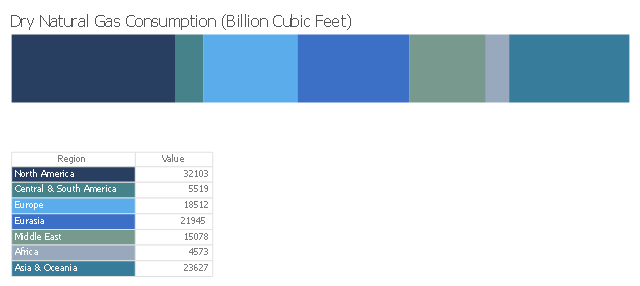
This divided bar diagram sample shows the global natural gas consumption by regions in 2013. It was designed using data of the International Energy Statistics webpage from the U.S. Energy Information Administration (EIA) website. [eia.gov/ cfapps/ ipdbproject/ IEDIndex3.cfm?tid=3&pid=26&aid=2]
"Natural gas is a fossil fuel formed when layers of buried plants and animals are exposed to intense heat and pressure over thousands of years. The energy that the plants originally obtained from the sun is stored in the form of chemical bonds in natural gas. Natural gas is a nonrenewable resource because it cannot be replenished on a human time frame. Natural gas is a hydrocarbon gas mixture consisting primarily of methane, but commonly includes varying amounts of other higher alkanes and even a lesser percentage of carbon dioxide, nitrogen, and hydrogen sulfide. Natural gas is an energy source often used for heating, cooking, and electricity generation. It is also used as fuel for vehicles and as a chemical feedstock in the manufacture of plastics and other commercially important organic chemicals." [Natural gas. Wikipedia]
The chart example "Global natural gas consumption" was created using ConceptDraw PRO diagramming and vector drawing software extended with the Divided Bar Diagrams solution from the Graphs and Charts area of ConceptDraw Solution Park.
Divided bar chart
This pie chart sample shows the atmosphere air composition. It was designed on the base of the Wikimedia Commons file: Air composition pie chart.JPG.
[commons.wikimedia.org/ wiki/ File:Air_ composition_ pie_ chart.JPG]
This file is licensed under the Creative Commons Attribution-Share Alike 3.0 Unported license. [creativecommons.org/ licenses/ by-sa/ 3.0/ deed.en]
"The atmosphere of Earth is a layer of gases surrounding the planet Earth that is retained by Earth's gravity. The atmosphere protects life on Earth by absorbing ultraviolet solar radiation, warming the surface through heat retention (greenhouse effect), and reducing temperature extremes between day and night (the diurnal temperature variation).
The common name given to the atmospheric gases used in breathing and photosynthesis is air. By volume, dry air contains 78.09% nitrogen, 20.95% oxygen, 0.93% argon, 0.039% carbon dioxide, and small amounts of other gases. Air also contains a variable amount of water vapor, on average around 1%. Although air content and atmospheric pressure vary at different layers, air suitable for the survival of terrestrial plants and terrestrial animals currently is only known to be found in Earth's troposphere and artificial atmospheres." [Atmosphere of Earth. Wikipedia]
The pie chart example "Atmosphere air composition" was created using the ConceptDraw PRO diagramming and vector drawing software extended with the Pie Charts solution of the Graphs and Charts area in ConceptDraw Solution Park.
Pie chart

The vector stencils library "Picture Graphs" contains 35 templates of picture bar graphs for visual data comparison and time series.
Drag a template from the library to your document, set bars number, type category labels, select bars and enter your data.
Use these shapes to draw your pictorial bar charts in the ConceptDraw PRO diagramming and vector drawing software.
The vector stencils library "Picture Graphs" is included in the Picture Graphs solution from the Graphs and Charts area of ConceptDraw Solution Park.
Arrow
Water drop

Food

Grain

Agriculture

Medicines

Houses

Buildings

Money bags

Oil barrels

Natural gas

Electrical power

Nuclear power

Mechanical engineering

Chemical industry

Mining

Gold bars

Coins

Person

Men, women and children

Man

Woman

Child

Milk

Meat

Fruits

Vegetables

Computer

Mobile phone

Airliner

Car

Bus

Truck

Train

Cargo ship

- Atmosphere air composition | Percentage Pie Chart . Pie Chart ...
- Pie Chart Nitrogen Oxygen Carbondioxide Gas
- Atmosphere air composition | Pie Chart For Air Gas
- Gas Components Of Earth Pie Chart
- Atmosphere Gases Pie Chart
- Formation Of Petroleum And Natural Gas Flow Chart
- Natural gas condensate - PFD | Process Flow Chart | Process Flow ...
- Gas Chart In Atmosphere Flowchart
- Gas Pie Chart