HR Flowchart Symbols

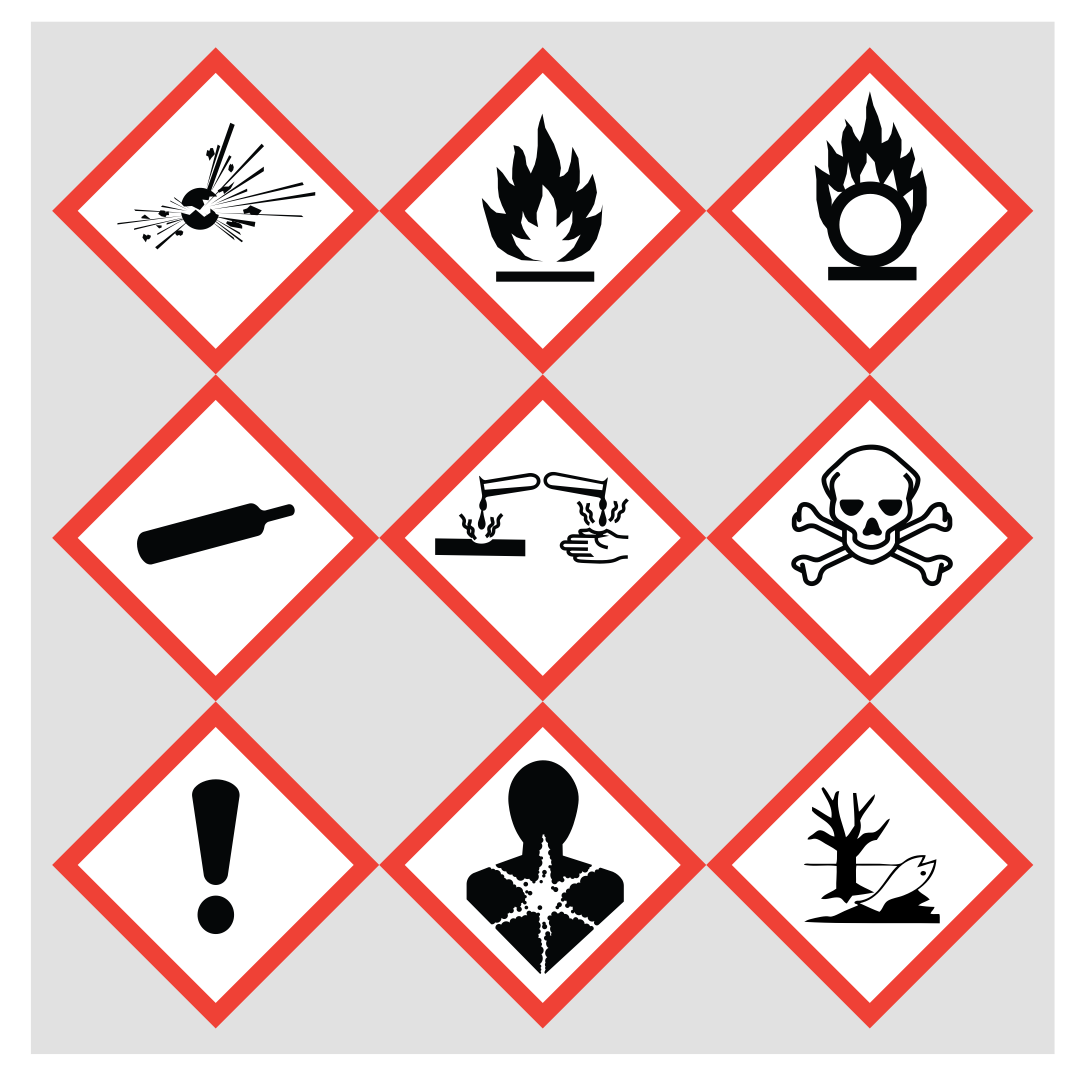
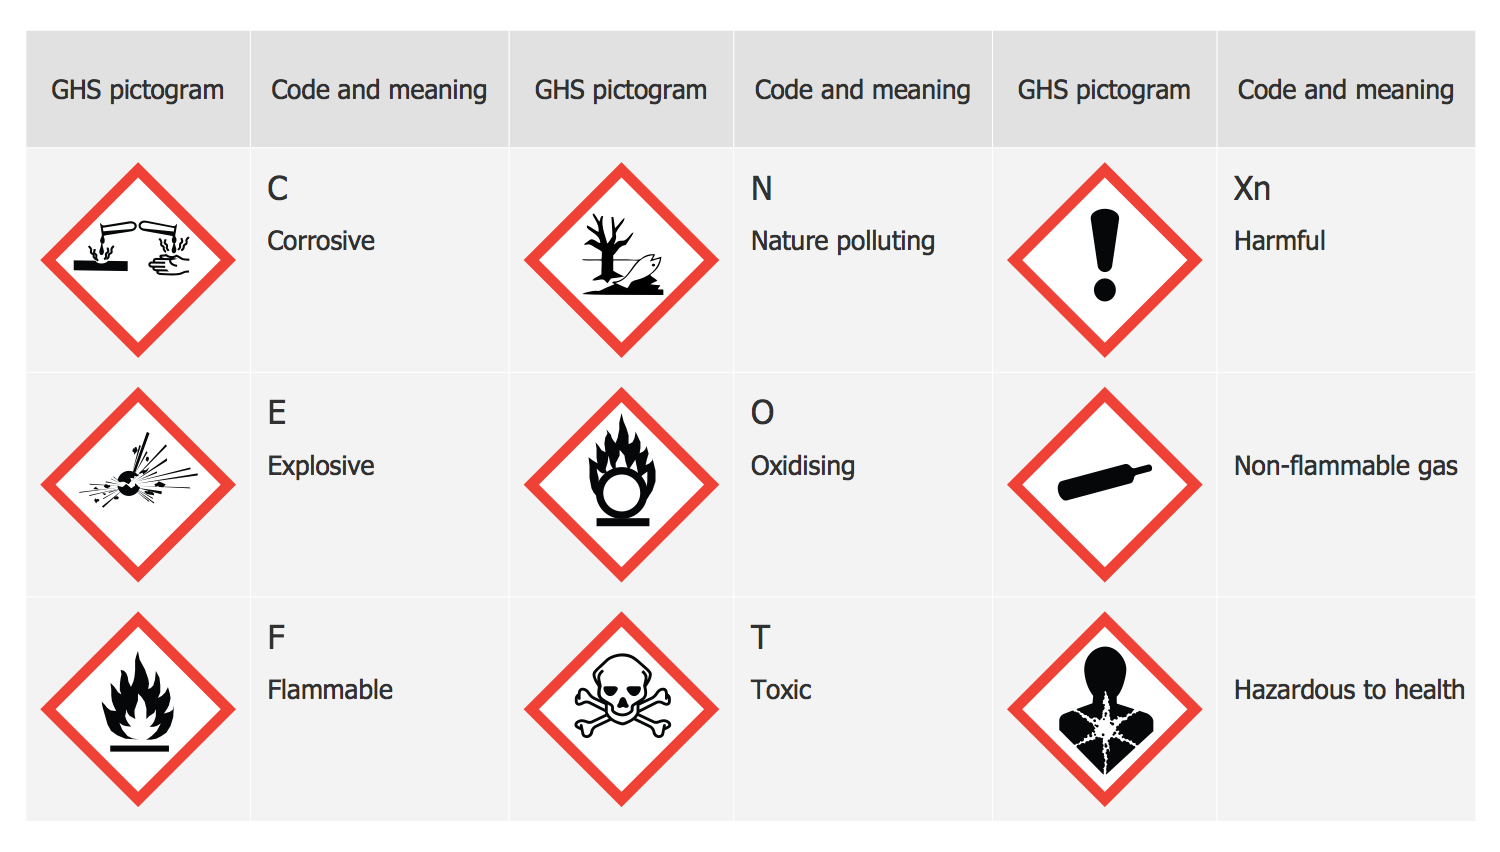
 GHS Hazard Pictograms
GHS Hazard Pictograms solution contains the set of predesigned standard GHS pictograms, Hazardous symbols, and Hazard communication pictograms, approved and agreed by UN in Globally Harmonized System of Classification and Labelling of Chemicals (GHS). They can be used for quick and simple designing accurate and professional-looking infographics, diagrams, warning announcements, signboards, posters, precautionary declarations, regulatory documents, and for representing the main items of OSHA HAZCOM Standard.
OSHA HAZCOM pictograms
The vector stencils library "Marketing pictograms" contains pictogram set of 34 flaticons.
Use these flat icons to design your marketing infograms.
"A pictogram, also called a pictogramme, pictograph, or simply picto, and also an 'icon', is an ideogram that conveys its meaning through its pictorial resemblance to a physical object. Pictographs are often used in writing and graphic systems in which the characters are to a considerable extent pictorial in appearance." [Pictogram. Wikipedia]
The shapes example "Design elements - Marketing pictograms" was created using the ConceptDraw PRO diagramming and vector drawing software extended with the Marketing Infographics solition from the area "Business Infographics" in ConceptDraw Solution Park.
Flat icons
GHS Label Pictograms
Design Pictorial Infographics. Design Infographics

The vector stencils library "Management pictograms" contains 72 ideograms. Use this flat icon set to design your management infograms.
"An ideogram or ideograph is a graphic symbol that represents an idea or concept, independent of any particular language, and specific words or phrases. Some ideograms are comprehensible only by familiarity with prior convention; others convey their meaning through pictorial resemblance to a physical object, and thus may also be referred to as pictograms." [Ideogram. Wikipedia]
The ideogram example "Design elements - Management pictograms" was created using the ConceptDraw PRO diagramming and vector drawing software extended with the Management Infographics solition from the area "Business Infographics" in ConceptDraw Solution Park.
Management pictograms

Pictorial Chart

Electrical Symbols, Electrical Diagram Symbols

Sample Pictorial Chart. Sample Infographics

How to Draw Pictorial Chart. How to Use Infograms

ERD Symbols and Meanings


The vector stencils library "Cloud round icons" contains 184 cloud computing pictograms.
Use it to design your cloud computing diagrams and infographics with ConceptDraw PRO software.
"Graphically, the icon is a stylized picture of objects that users are familiar with from office environment or from other professional arenas. ...
The design of all computer icons is constricted by the limitations of the device display. ... They are frequently scalable, as they are displayed in different positions in the software. The colors used, of both the image and the icon background, should stand out on different system backgrounds. The detailing of the icon image needs to be simple, remaining recognizable in varying graphical resolutions and screen sizes. Computer icons are by definition language-independent; they do not rely on letters or words to convey their meaning." [Icon (computing). Wikipedia]
The icon set example "Design elements - Cloud round icons" is included in the Cloud Computing Diagrams solution from the Computer and Networks area from ConceptDraw Solution Park.
Cloud computing pictograms
Education Information
- Pictogram Definition Example
- Examples Of Filing Pictogram
- Design elements - Medicine and health pictograms | Medicine and ...
- HR Flowchart Symbols | Infographic Examples | Map Software ...
- Example Of Pictogramme
- Travel and tourism pictograms - Vector stencils library | Design ...
- Time and clock pictograms - Vector stencils library | Design ...
- Design elements - Management pictograms | Design elements ...
- Medicine and health pictograms - Vector stencils library | Basic ...
- GHS Hazard Pictograms | Fire Exit Plan. Building Plan Examples ...
- Pictogram Meaning
- Basic Flowchart Symbols and Meaning | People pictograms - Vector ...
- Design elements - Management pictograms | Design elements - IVR ...
- Language Pictogram Png
- Pictograph Examples With Questions
- Shopping pictograms - Vector stencils library | Basic Flowchart ...
- Basic Flowchart Symbols and Meaning | Medicine and health ...
- People pictograms - Vector stencils library | Basic Flowchart ...
- GHS Hazard Pictograms | GHS hazard symbols | Design elements ...
- Management pictograms - Vector stencils library | Basic Flowchart ...