The vector stencils library "People pictograms" contains 20 icons of men and women symbols. Use it to draw your pictorial infograms. The example "People pictograms - Vector stencils library" was created using the ConceptDraw PRO diagramming and vector drawing software extended with the Pictorial infographics solution from the area "What is infographics" in ConceptDraw Solution Park.
Man

Woman

Child

Joyful man

Man on a bicycle

Old man

Man in wheelchair

Man pushing the shopping trolley

Sitting man reading

Man kneeling

Man sitting on the floor

Man lying under parasol

Running man

Man exit

Man climbing stairs

Man carrying a box

Man cooking

Man throwing garbage into a trash can

Man photographing

Winner

Basic Flowchart Symbols and Meaning


The vector stencils library "Scrum workspace" contains 21 icons.
Use this clipart set to design your agile software development diagrams and infographics with ConceptDraw PRO software.
"... a list of all the things that ... should be visible within the ideal agile workspace:
Big Visible Charts. ... the sprint burndown chart, showing the number of hours remaining as of each day of the current sprint. ... big visible charts showing the number of passing customer acceptance tests, the pass/ fail status of tests by day, sprint and release burndown charts, number of new stories introduced to the product backlog per sprint, and more.
Additional feedback devices. In addition to big, visible charts, it is common for an agile team to use additional visual feedback devices in their workspace. One of the most common is a lava lamp that is turned on whenever the automated build is broken.
... flashing red traffic lights to indicate exceptional conditions such as an issue on a production server. Also popular are ambient orbs and Nabaztag rabbits, which are wireless programmable devices that can also be configured to change colors, speak messages, or wiggle their ears as a team desires. ...
Everyone on your team. Each person on the team should ideally be able to see each other person on the team. This absolutely includes the ScrumMaster and ideally includes the product owner. ...
The sprint backlog. One of the best ways to ensure that everything necessary is completed in the sprint is to make the sprint backlog visible. The best way to do that is by displaying the sprint backlog on a wall, ideally in the form of a task board ...
The product backlog. One problem with running an endless series of sprints is that each can feel disconnected or isolated from the whole of a planned released or related set of new capabilities. A good way to reduce the impact of this problem is by displaying the product backlog somewhere clearly visible. ... tack the index cards with those upcoming user stories on a wall where all can see them. This allows team members to see how the user stories they are working on in the current sprint relate to others that are coming soon.
At least one big white board. ... Locating this in the team’s common workspace encourages spontaneous meetings." [mountaingoatsoftware.com/ blog/ the-ideal-agile-workspace]
The clip art sample "Design elements - Scrum workspace" is included in the Scrum solution from the Project Management area of ConceptDraw Solution Park.
Icon set
Value Stream Mapping Symbols

Cross Functional Flowchart Symbols

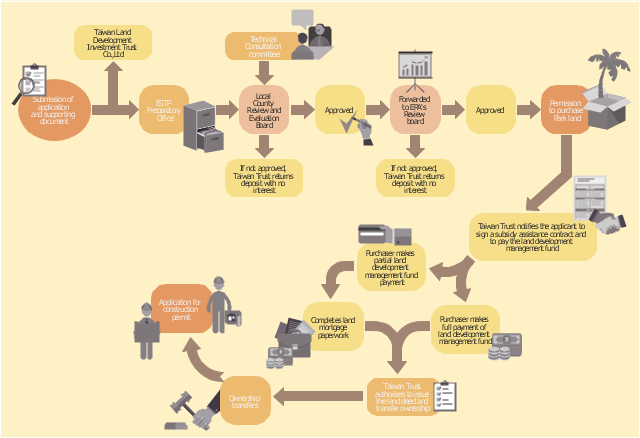
This example of business infographics was designed on the base of flowchart in the webpage "Establishing Operations in an Environmental Protection Park" from the website of Taiwan Department of Investment Services, Ministry of Economic Affairs.
"Upon registration of the company, the "Guideline for Operation and Management of Environmental Science and Technology Park Promotion Program" and "Guideline for Execution of Subsidies for Environmental Science and Technology Park Promotion Program" shall be followed for applying for admission to the Park. Any foreigner who wishes to invest in and build a factory in the Park shall apply to the local Preparatory Office of ESTP for admission approval. It will take approximately two months to secure such approval from the application submission date. The investment and construction application procedures prescribed by preparatory Office of ESTP in Southern Taiwan are shown below for reference." [investtaiwan.nat.gov.tw/ eng/ show.jsp?ID=123&MID=2]
The infographics example "Investment and construction application procedures" was created using the ConceptDraw PRO diagramming and vector drawing software extended with the HR Flowcharts solution from the Management area of ConceptDraw Solution Park.
Flowchart infographics
Collaboration in a Project Team

Planogram Software and Retail Plan Software

How To Use Collaboration Software


The vector stencils library "Picture bar graphs" contains 35 templates of pictorial charts. Use it for visualization of data comparison and time series with ConceptDraw PRO diagramming and vector drawing software.
"Pictorial bar graph.
Sometimes reffered to as a pictographs. A pictorial bar graph is a graph in which the rectangular bars have been filled with pictures, sketches, icons, etc. or where pictures, sketches, icons, etc. have been substituted for the rectangular bars. In both variations, one or more symbols might be used in each bar. The two major reasons for using pictorial graphs are to make the graph more appealing visually and to facilitate better communications." [Information Graphics: A Comprehensive Illustrated Reference. R. L. Harris. 1999. p.41]
The pictorial charts example "Design elements - Picture bar graphs" is included in the Picture Graphs solution from the Graphs and Charts area of ConceptDraw Solution Park.
Templates

- Person Carrying Icon Png
- People pictograms - Vector stencils library | People pictograms ...
- Man Sitting In A Chair Png Icon
- People pictograms - Vector stencils library | People pictograms ...
- People pictograms - Vector stencils library | Cisco people - Vector ...
- Sit People Icon Vector Png
- Design elements - Cisco people | Exporting ConceptDraw PRO ...
- Cisco people - Vector stencils library | Design elements - Cisco ...
- Cisco People . Cisco icons , shapes, stencils and symbols | Design ...
- People pictograms - Vector stencils library | People pictograms ...
- People pictograms - Vector stencils library | Business people ...
- People pictograms - Vector stencils library | Design elements ...
- People Vector Png
- People pictograms - Vector stencils library | Amazon Web Services ...
- People Icon Png
- Person Vector Png
- Design elements - People | People - Vector stencils library ...
- People Elements Png
- Shopping Infographic Png
- Exit Icon