How To Use Collaboration Software
MindMap Collaboration Software
The Remote Presentation for Skype solution allows to show over Skype presentations created in ConceptDraw MINDMAP . Next tips helps you to show your own mindmap:
- open ConceptDraw MINDMAP file
- start Skype
- click Skype Presentation button
- in "ConceptDraw MindMap Presentation" dialog click "Show" button
- allow access to Skype for ConceptDraw MINDMAP
- call a person or group
- wait until all participants are connected
- start presentation with Space key
- use left/right arrow keys for navigation between slides
- use Escape key to finish presentation
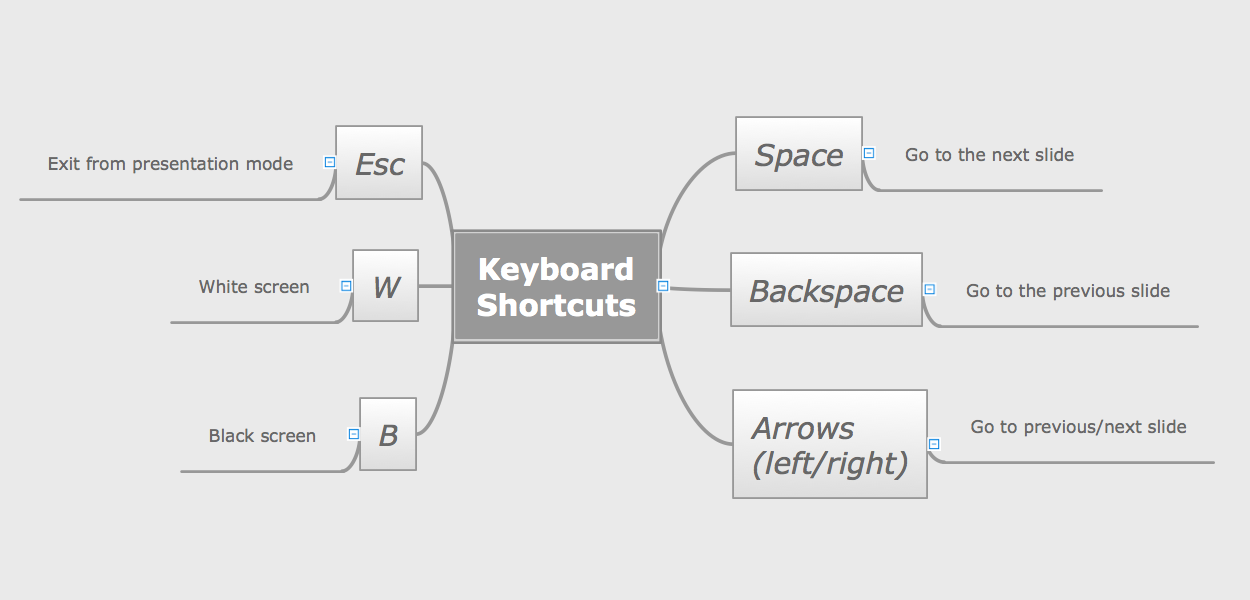
Sample 1. Keyboard Shortcuts
"ConceptDraw Remote Presentation for Skype solution keyboard shortcuts" mind map is created using ConceptDraw MINDMAP mind mapping software.
This mind map helps to learn how to use Remote Presentation for Skype solution from ConceptDraw Solution Park.
See also Samples:
TEN RELATED HOW TO's:
Use team meetings, share ideas, brainstorm ideas, team notes with ConceptDraw solution.
Picture: A Tool for EffectiveTeam Meetings
Related Solution:
Preparing for presentations easy with ConceptDraw MINDMAP.
Picture: How to Prepare for a Presentation
Related Solution:
Interactive tool helps you find the appropriate response to social media mentions quickly.
Picture: How to Use the ″Online Store PR Campaign″ Sample
Related Solution:
ConceptDraw DIAGRAM enhanced with Flowcharts Solution is the best flow chart maker online design software. Use it to ✔️ create clear and actionable Flowcharts, ✔️ improve decision-making, ✔️ enhance problem-solving in various scenarios, ✔️ enhance creativity and productivity across industries, ✔️ streamline workflows
Picture: Flow Chart Online
Related Solution:
ConceptDraw DIAGRAM - workflow software extended with the Workflow Diagram solution provides a complete set of samples, templates and features help you to draw diagrams faster. A workflow software you use for drawing workflow diagrams and business process flow diagrams should provide a wide set of examples allows you get closer with workflow diagrams, learn symbols meaning, find appropriate layout and design, and then start drawing your own workflow diagram masterfully. Workflow diagrams used for orchestrating organizational processes between company departments and humans, so critical process diagrams used to train many people to interact must be clear and professional to convey an idea from a view. Thats a reason we created a lot workflow symbols and workflow icons collected them into special Workflow Diagram solution in ConceptDraw Solution Park.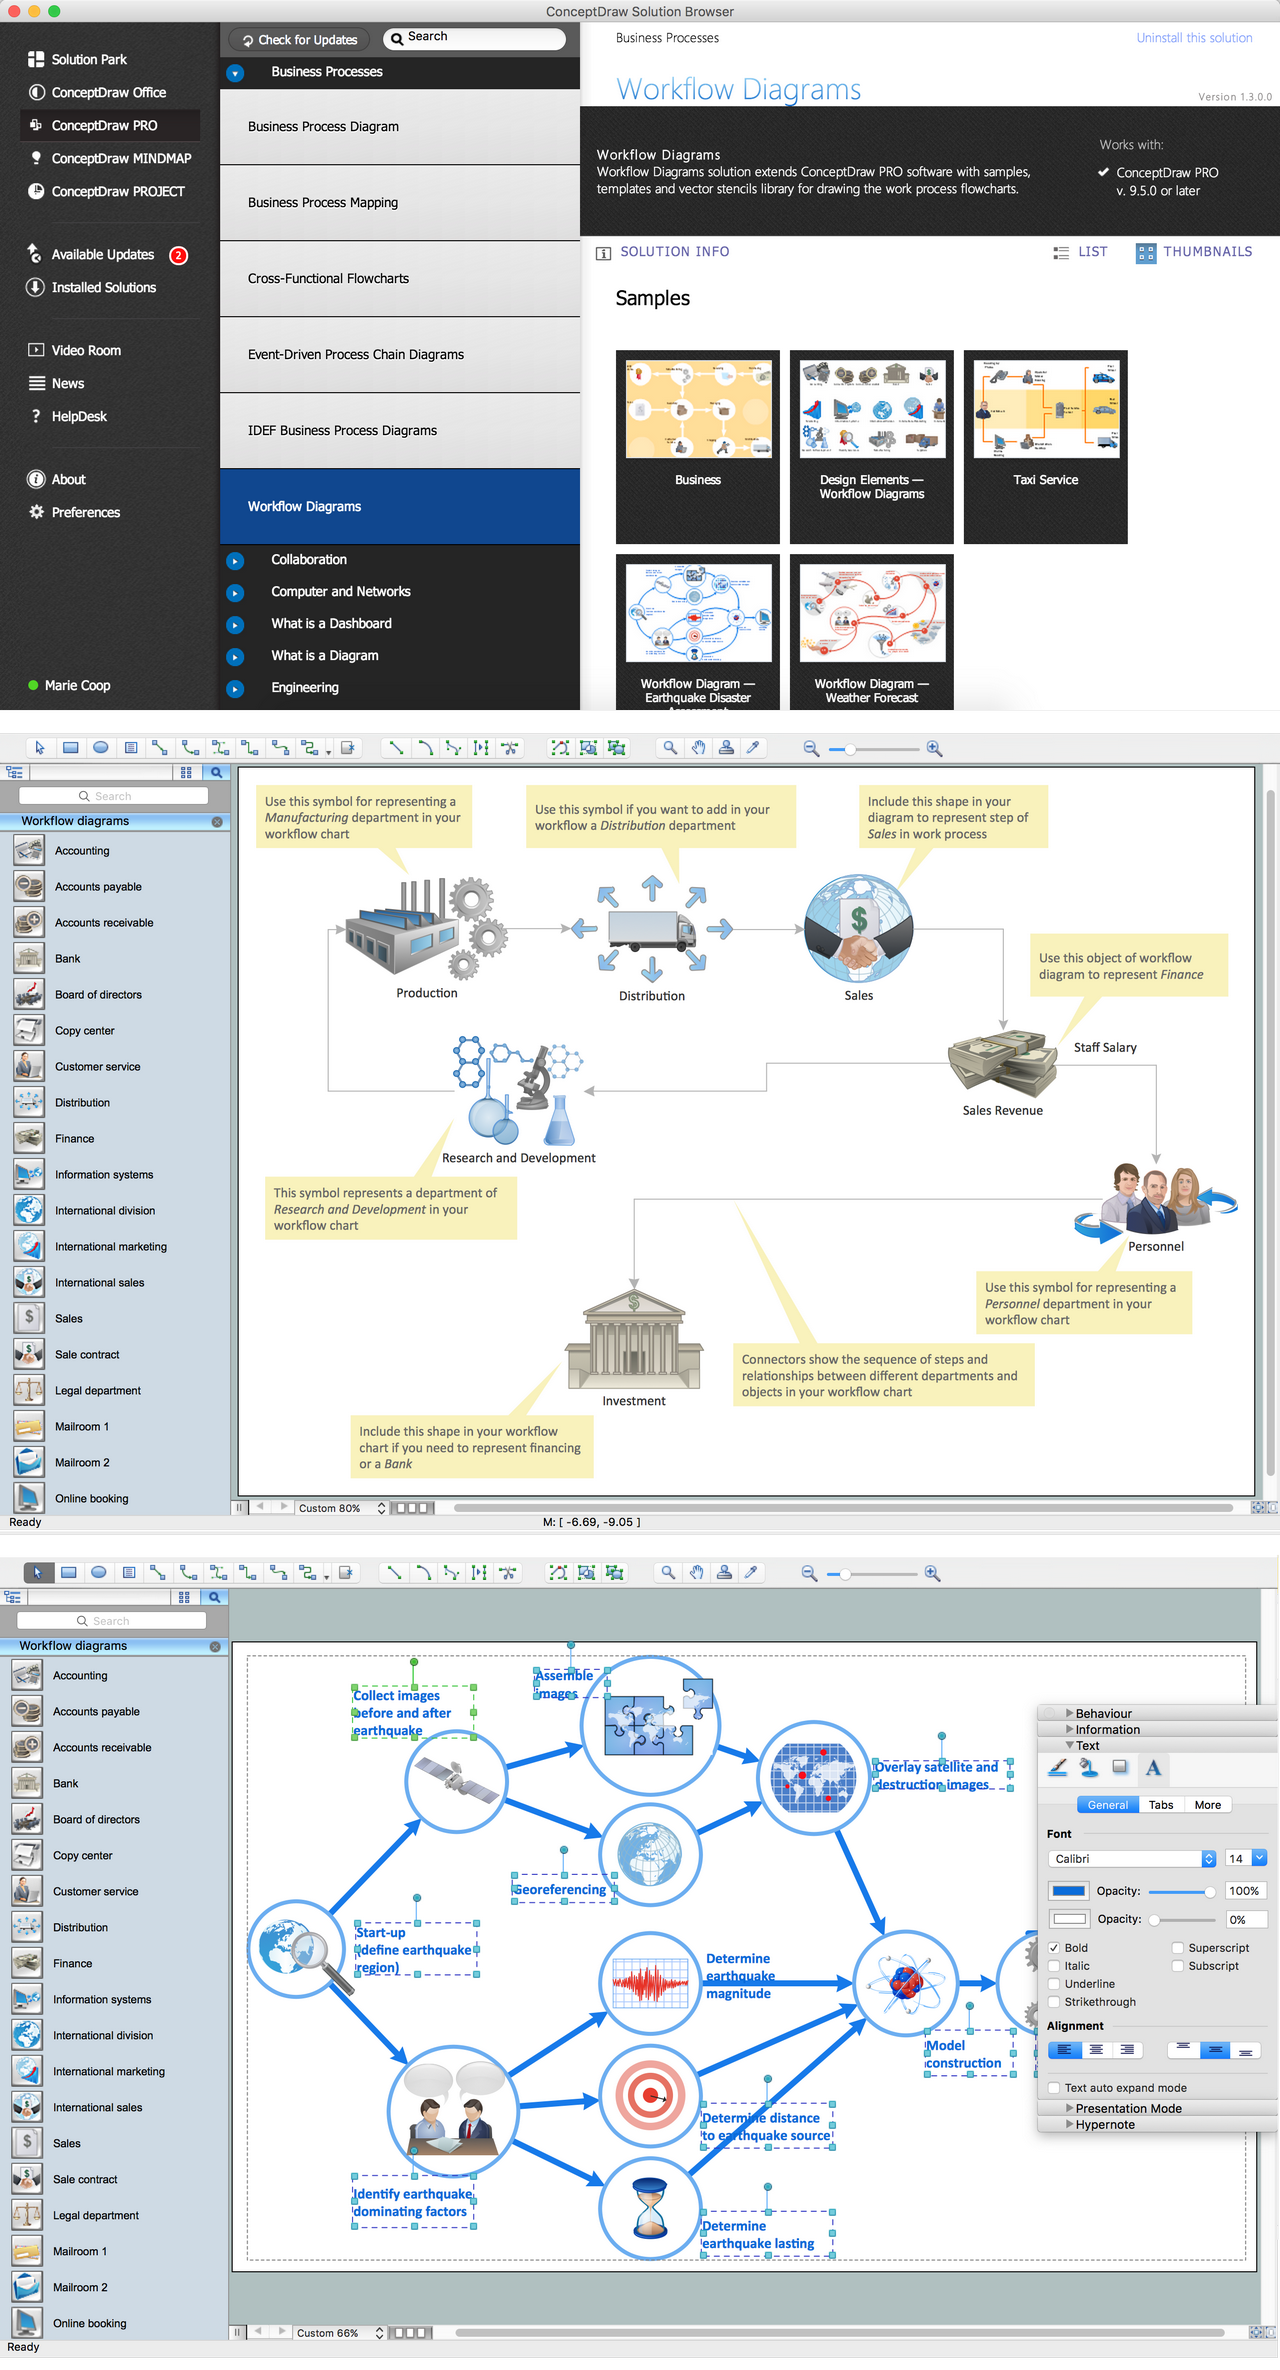
Picture: Workflow Diagram Examples
Related Solution:
Create professional business process diagram with ConceptDraw.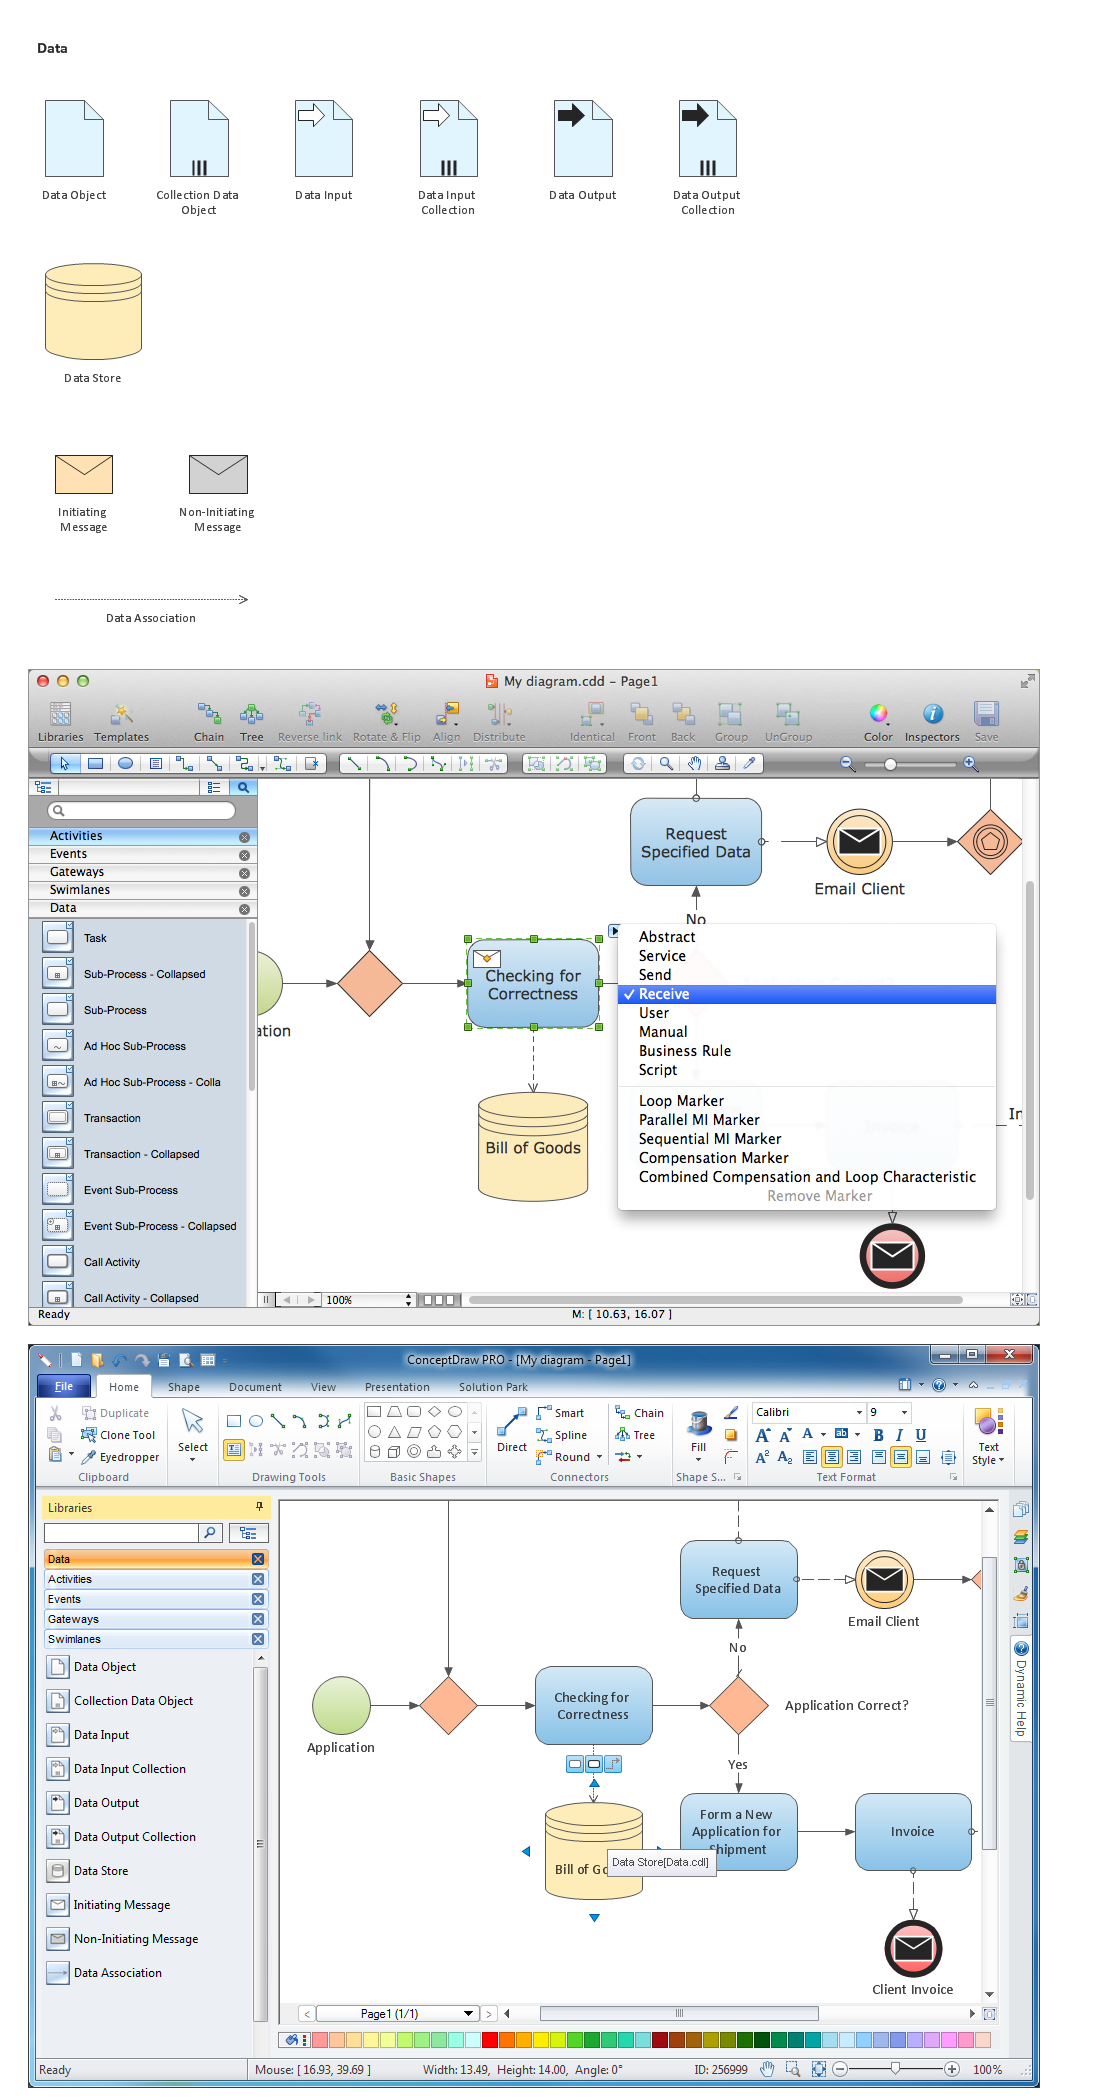
Picture: Diagramming Software for Business Process
ConceptDraw is your tool for driving social integration and managing change across and streamline social media processes of your organisation.This tool keeps the entire team on the same page allowing you to realize your social media strategy, improve the quality of your answers, and minimize the time it takes to respond.
Picture: Social Media Response Management DFD Charts - software tools
Related Solution:
The Total Quality Management Diagram solution helps you and your organization visualize business and industrial processes. Create Total Quality Management diagrams for business process with ConceptDraw software.
Picture: Total Quality Management Business Diagram
Related Solution:
Each business is created, exists and develops according to its type of business structure. Creating new business or developing existing, you may need a powerful software for representing its business structure. In this case ConceptDraw DIAGRAM diagramming and vector drawing software extended with 25 Typical Orgcharts solution from the Management area is exactly what you need.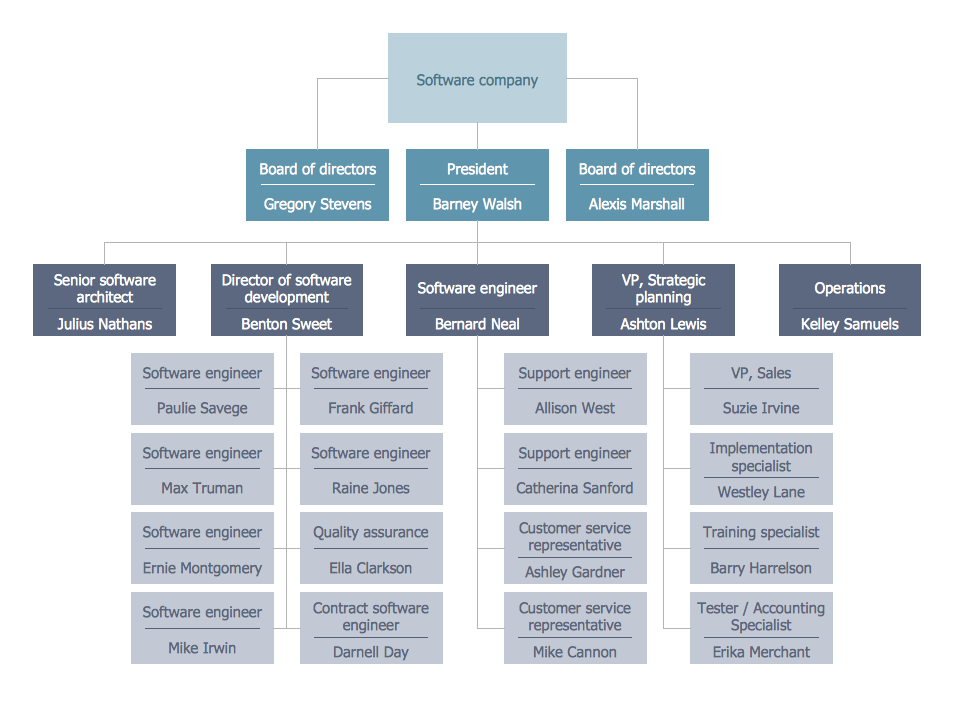
Picture: Business Structure
Related Solution:
Structured-systems analysis and design method uses data flow diagrams to represent the process of data flowing through a system. Talking about this might be useless without a proper example of DFD for online store (Data Flow Diagram). This DFD example shows all the distinctness that a diagram can bring into a scattered data structure.
Data flow diagrams are used to show how data is processed within some business processes. Making DFD is a common practice for business process modeling and analysis. This diagram represents the online store business flow. It describes inputs and outputs within online selling process and depicts the interactions between its participants. This DF diagram can be used by system analysts to create an overview of a business, to study and discover its inherent strengths and weak points.
Picture: Example of DFD for Online Store (Data Flow Diagram)
Related Solution:
ConceptDraw
MINDMAP 16