Geo Map — Europe — France

Venn Diagram

Stakeholder Onion Diagram Template

Total Quality Management Definition

Venn Diagram Template for Word

Organizational Structure Total Quality Management

Landscape Plan

HelpDesk
How to Create a Venn Diagram in ConceptDraw PRO

Control and Information Architecture Diagrams (CIAD) with ConceptDraw PRO

How To use Landscape Design Software

Landscape Plan
 Logistics Flow Charts
Logistics Flow Charts solution extends ConceptDraw PRO v11 functionality with opportunities of powerful logistics management software. It provides large collection of predesigned vector logistic symbols, pictograms, objects and clipart to help you design with pleasure Logistics flow chart, Logistics process flow diagram, Inventory flow chart, Warehouse flowchart, Warehouse management flow chart, Inventory control flowchart, or any other Logistics diagram. Use this solution for logistics planning, to reflect logistics activities and processes of an enterprise or firm, to depict the company's supply chains, to demonstrate the ways of enhancing the economic stability on the market, to realize logistics reforms and effective products' promotion.
 Fishbone Diagrams
The Fishbone Diagrams solution extends ConceptDraw PRO v10 software with the ability to easily draw the Fishbone Diagrams (Ishikawa Diagrams) to clearly see the cause and effect analysis and also problem solving. The vector graphic diagrams produced using this solution can be used in whitepapers, presentations, datasheets, posters, and published technical material.
How To Draw Building Plans


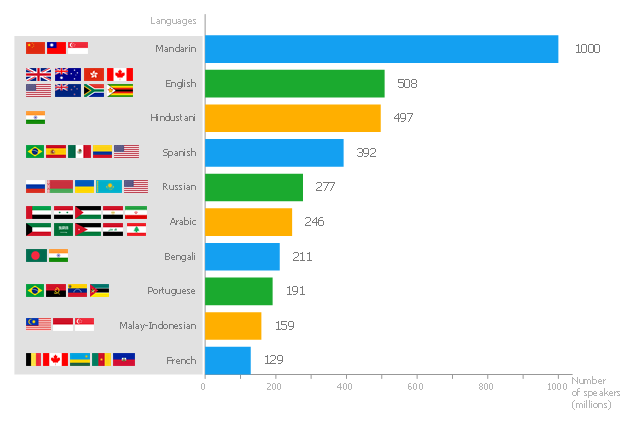
This horizontal bar graph sample shows the number of speakers for the most spoken languages of the world. "In the philosophy of language, a natural language (or ordinary language) is any language which arises in an unpremeditated fashion as the result of the innate facility for language possessed by the human intellect. A natural language is typically used for communication, and may be spoken, signed, or written. Natural language is distinguished from constructed languages and formal languages such as computer-programming languages or the "languages" used in the study of formal logic, especially mathematical logic. ... Though the exact definition varies between scholars, natural language can broadly be defined in contrast on the one hand to artificial or constructed languages, computer programming languages like Python and international auxiliary languages like Esperanto, and on the other hand to other communication systems in nature, such as the waggle dance of bees. Although there are a variety of natural languages, any cognitively normal human infant is able to learn any natural language. By comparing the different natural languages, scholars hope to learn something about the nature of human intelligence and the innate biases and constraints that shape natural language, which are sometimes called universal grammar. The term "natural language" refers only a language that has developed naturally, and hence to actual speech, rather than prescribed speech. Hence, unstandardized speech (such as African American Vernacular English) is natural, whereas standardized speech such as Standard American English, which is in part prescribed, is somewhat artificial." [Natural language. Wikipedia] The horizontal bar chart example "The most spoken languages of the world" was created using the ConceptDraw PRO diagramming and vector drawing software extended with the Basic Bar Graphs solution from the Graphs and Charts area of ConceptDraw Solution Park.
Horizontal bar graph
- Concept Map Of Philosophy
- Continents Map | Geo Map - USA - Maryland | 7 Continents Map ...
- Geo Map - Europe - France | Basic Flowchart Symbols and Meaning ...
- Total Quality Management Value | Probability Quality Control Tools ...
- The most spoken languages of the world | Geo Map - Asia ...
- Geo Map - Europe - Czech Republic | How To use Landscape ...
- Languages of South America - Thematic map | The most spoken ...
- Horizontal bar chart - The most spoken languages of the world | Geo ...
- Winter Sports | Geo Map - USA - Montana | How To use Landscape ...
- Fruit Art | F&B | Modern Garden Design | Mind Map Designs Using ...
- Visio Files and ConceptDraw | Stakeholder Onion Diagram ...
- Basketball Field in the Vector | Basketball Illustrations | Vector Map ...
- Landscape Design Map
- Sport fields and recreation - Vector stencils library | Geo Map ...
- Design elements - 3D directional maps | Electric and Telecom Plans ...
- How To Make a Concept Map | Bubble Map Maker | Landscape ...
- Picture Graph | How to Draw a Line Graph | Continent Maps | How ...
- Draw Map Of Fundamental Rights
- Geo Map - Asia - Philippines | Middle East and North Africa's real ...
- Competitor Analysis | Marketing | SWOT analysis matrix diagram ...