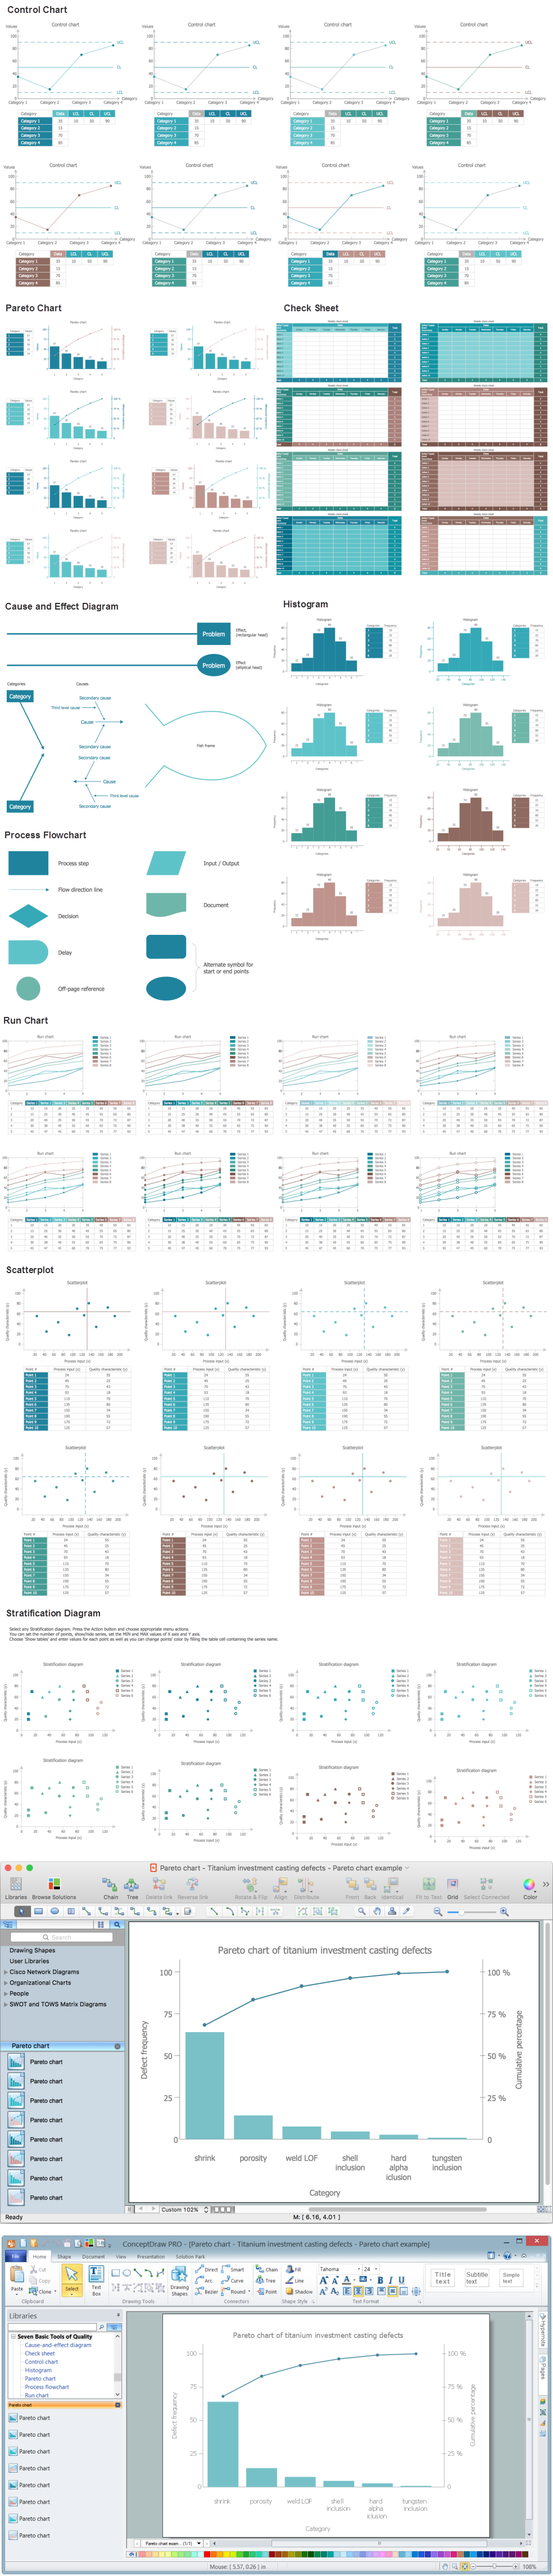
Seven Basic Tools of Quality - Pareto Chart
Total Quality Management with ConceptDraw

HelpDesk
How to Draw a Pareto Chart

 Seven Basic Tools of Quality
Manage quality control in the workplace, using fishbone diagrams, flowcharts, Pareto charts and histograms, provided by the Seven Basic Tools of Quality solution.
Examples of Flowcharts, Org Charts and More


Seven Basic Tools of Quality — Quality Control

 Fishbone Diagrams
The Fishbone Diagrams solution extends ConceptDraw DIAGRAM software with the ability to easily draw the Fishbone Diagrams (Ishikawa Diagrams) to clearly see the cause and effect analysis and also problem solving. The vector graphic diagrams produced using this solution can be used in whitepapers, presentations, datasheets, posters, and published technical material.
Seven Basic Tools of Quality - Histogram

 Business Package for Management
Package intended for professional who designing and documenting business processes, preparing business reports, plan projects and manage projects, manage organizational changes, prepare operational instructions, supervising specific department of an organization, workout customer service processes and prepare trainings for customer service personal, carry out a variety of duties to organize business workflow.
- Pareto Diagram In Total Quality Management
- How to Draw a Pareto Chart Using ConceptDraw PRO | Pareto ...
- Seven Basic Tools of Quality - Pareto Chart | Total Quality ...
- Process Flowchart | TQM Diagram — Professional Total Quality ...
- Process Flowchart | TQM Software — Build Professional TQM ...
- Seven Basic Tools of Quality | How to Draw a Pareto Chart Using ...
- Seven Basic Tools of Quality - Flow Chart | Seven Basic Tools of ...
- How Do Fishbone Diagrams Solve Manufacturing Problems | TQM ...
- Process Flowchart | Seven Basic Tools of Quality - Flow Chart | TQM ...
- Quality Control Chart Software — ISO Flowcharting | Seven Basic ...
- Quality Control Chart Software — ISO Flowcharting | Process ...
- Process Flowchart | Quality Control Chart Software — ISO ...
- Fishbone Diagram | Total Quality Management TQM Diagrams ...
- Circular Arrows Diagrams | Process Flowchart | Total Quality ...
- Swim Lane Diagrams | Types of Flowcharts | TQM Diagram Example ...
- Probability Quality Control Tools | Process Flowchart | Decision ...
- New Seven Managnent Tools Diagram
- Pareto chart - Titanium investment casting defects | Examples of ...
- Total Quality Management Value | Seven Basic Tools of Quality ...
- TQM Diagram Tool | Probability Quality Control Tools | Seven Basic ...