"Order processing is a key element of Order fulfillment. Order processing operations or facilities are commonly called "distribution centers". "Order processing" is the term generally used to describe the process or the work flow associated with the picking, packing and delivery of the packed item(s) to a shipping carrier. The specific "order fulfillment process" or the operational procedures of distribution centers are determined by many factors. Each distribution center has its own unique requirements or priorities." [Order processing. Wikipedia]
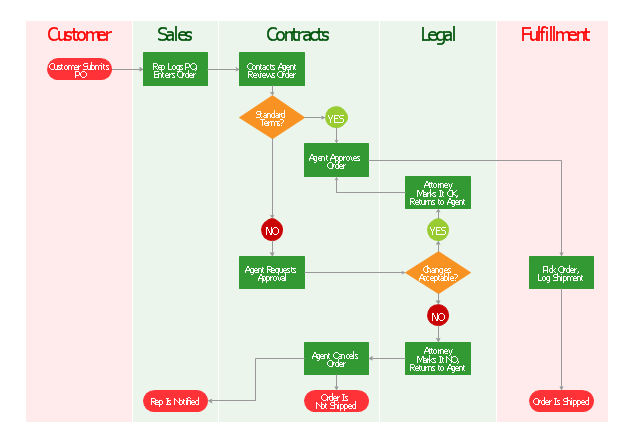
The vertical cross-functional flow chart example "Order processing" was created using the ConceptDraw PRO diagramming and vector drawing software extended with the Flowcharts solution from the area "What is a Diagram" of ConceptDraw Solution Park.
The vertical cross-functional flow chart example "Order processing" was created using the ConceptDraw PRO diagramming and vector drawing software extended with the Flowcharts solution from the area "What is a Diagram" of ConceptDraw Solution Park.
Cross-functional flowchart
Data Flow Diagram

 Logistics Flow Charts
Logistics Flow Charts solution extends ConceptDraw DIAGRAM functionality with opportunities of powerful logistics management software. It provides large collection of predesigned vector logistic symbols, pictograms, objects and clipart to help you design with pleasure Logistics flow chart, Logistics process flow diagram, Inventory flow chart, Warehouse flowchart, Warehouse management flow chart, Inventory control flowchart, or any other Logistics diagram. Use this solution for logistics planning, to reflect logistics activities and processes of an enterprise or firm, to depict the company's supply chains, to demonstrate the ways of enhancing the economic stability on the market, to realize logistics reforms and effective products' promotion.
Program Evaluation and Review Technique (PERT) with ConceptDraw DIAGRAM

Workflow Diagram

 Funnel Diagrams
Funnel Diagrams solution including wide range of funnel diagram samples, sales funnel examples, and vector design elements, makes the ConceptDraw DIAGRAM ideal for funnel management and creation the Funnel Diagrams of different types and designs, AIDA Model, AIDAS, ACCA Dagmar, Rossiter-Percy Model, Sales funnel, Marketing funnel, Search funnel, Brand funnel, Purchase funnel, Lead funnel, Conversion funnel, Business funnel, etc. You are free to choose to place your funnel object horizontally or vertically, you can use the objects with desired quantity of sales funnel stages, as well as to modify their size, color filling, and other parameters to make exceptionally looking Funnel diagrams fully responding to your desires.
EPC - Business Processes in Terms of Work Flows

Porter's Value Chain

Competitor Analysis

How to Discover Critical Path on a Gantt Chart

- Order processing - Cross-functional flowchart | Order processing ...
- Work Order Process Flowchart . Business Process Mapping ...
- Swim Lane Diagram Order Fulfillment
- Flowchart Marketing Process . Flowchart Examples | Work Order ...
- Order processing - Cross-functional flowchart | Order processing ...
- Cross-functional flowchart
- Cross-Functional Flowcharts in ConceptDraw | Business Process ...
- Work Order Process Flowchart . Business Process Mapping Examples
- Flowchart Software For Vertical Cross Functional Flowchart
- Omnichannel supply chain | Logistics Flow Charts | Process ...