This logistic flow chart sample shows the omnichannel supply chain.
It was designed on the base of the Wikimedia Commons file: Merret-grey.jpeg. [commons.wikimedia.org/ wiki/ File:Merret-grey.jpeg]
This file is licensed under the Creative Commons Attribution-Share Alike 4.0 International license. [creativecommons.org/ licenses/ by-sa/ 4.0/ deed.en]
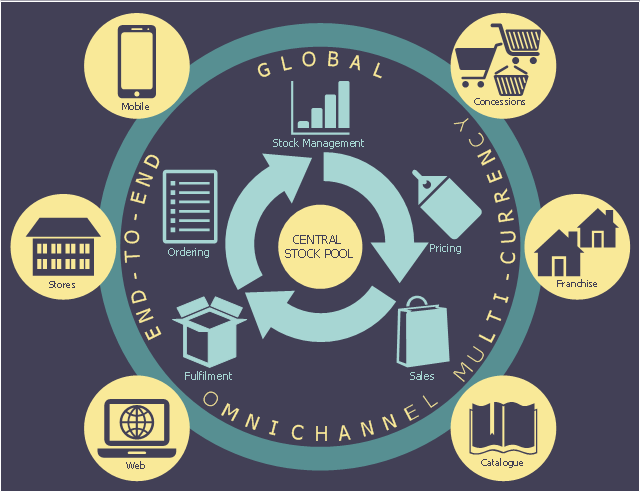
"An omnichannel supply chain uses a central stock pool to control a number of factors such as pricing, fulfilment, sales, stock management and ordering. These orders are fulfilled from numerous retail channels such as concessions, franchises, catalogue, web, stores and mobile. The central stock pool is the heart of all these operations. The supply chain is now on the front line thanks to omnichannel. Consumers are increasingly demanding in this day and age, expecting to be able to browse, buy and return goods through various channels and not just the traditional in-store way. This requires real-time, channel-agnostic visibility of inventory across the supply chain and a single view of the consumer as they hop from one channel to another." [Omnichannel Supply Chain. Wikipedia]
The logistic flowchart example "Omnichannel supply chain" was created using ConceptDraw PRO diagramming and vector drawing software extended with the Logistics Flow Charts solution from the Business Processes area of ConceptDraw Solution Park.
It was designed on the base of the Wikimedia Commons file: Merret-grey.jpeg. [commons.wikimedia.org/ wiki/ File:Merret-grey.jpeg]
This file is licensed under the Creative Commons Attribution-Share Alike 4.0 International license. [creativecommons.org/ licenses/ by-sa/ 4.0/ deed.en]
"An omnichannel supply chain uses a central stock pool to control a number of factors such as pricing, fulfilment, sales, stock management and ordering. These orders are fulfilled from numerous retail channels such as concessions, franchises, catalogue, web, stores and mobile. The central stock pool is the heart of all these operations. The supply chain is now on the front line thanks to omnichannel. Consumers are increasingly demanding in this day and age, expecting to be able to browse, buy and return goods through various channels and not just the traditional in-store way. This requires real-time, channel-agnostic visibility of inventory across the supply chain and a single view of the consumer as they hop from one channel to another." [Omnichannel Supply Chain. Wikipedia]
The logistic flowchart example "Omnichannel supply chain" was created using ConceptDraw PRO diagramming and vector drawing software extended with the Logistics Flow Charts solution from the Business Processes area of ConceptDraw Solution Park.
Logistic flowchart
 Logistics Flow Charts
Logistics Flow Charts solution extends ConceptDraw PRO v11 functionality with opportunities of powerful logistics management software. It provides large collection of predesigned vector logistic symbols, pictograms, objects and clipart to help you design with pleasure Logistics flow chart, Logistics process flow diagram, Inventory flow chart, Warehouse flowchart, Warehouse management flow chart, Inventory control flowchart, or any other Logistics diagram. Use this solution for logistics planning, to reflect logistics activities and processes of an enterprise or firm, to depict the company's supply chains, to demonstrate the ways of enhancing the economic stability on the market, to realize logistics reforms and effective products' promotion.
Process Flowchart


Competitor Analysis

Types of Flowcharts


 Area Charts
Area Charts are used to display the cumulative totals over time using numbers or percentages; or to show trends over time among related attributes. The Area Chart is effective when comparing two or more quantities. Each series of data is typically represented with a different color, the use of color transparency in an object’s transparency shows overlapped areas and smaller areas hidden behind larger areas.
- Online Marketing Objectives | Omnichannel supply chain | Groups in ...
- Stock Management At Restaurant Flowchart
- Stock Market Project Flow
- Stock Flow Through The Store
- Warehouse Stock Clipart
- Stock Flow Diagram From Storage To Custom
- Stock Flow In The Store
- Stock Market Project File Diagram Or Flow Chart
- Process Flowchart | Competitor Analysis | Flow chart Example ...
- Stock Control System Flowchart
- Venn Diagram | Competitor Analysis | Process Flowchart | Stock ...
- Stock Ordering Process Flowchart
- Data Flow Chat Order Stock Control Computing Project
- Process Flowchart | Line Graph Stock Photo
- Stock Control System Flow Chart
- Stock Flow Through A Store
- Diagram Showing Working Of A Stock Exchange
- ER Diagram For Raw Material Stock Management System
- Diagram To Explain A Stock Flow In The Store
- Show The Flow Of Stock And Sales And Cash Through A Wholesale ...