This site uses cookies. By continuing to browse the ConceptDraw site you are agreeing to our Use of Site Cookies.

Online Flow Chart

ConceptDraw DIAGRAM diagramming and vector drawing software extended with tools of Flowcharts Solution from the "Diagrams" Area of ConceptDraw Solution Park ideally suits for fast and easy Online Flow Chart designing. We propose to verify this right now.

Flow Chart Online

Flow Chart is a great visualization tool for the flow of a process, algorithm or procedure with a lot of benefits. It is convenient to use a powerful software for creating flow charts. Now we have the best flow chart maker online design software - ConceptDraw DIAGRAM enhanced with Flowcharts Solution from the "Diagrams" Area of ConceptDraw Solution Park.

ConceptDraw Solution Park ConceptDraw Solution Park

ConceptDraw Solution Park
ConceptDraw Solution Park collects graphic extensions, examples and learning materials

How to Create a Social Media DFD Flowchart

Interactive tool helps you create a social media DFD flowchart to find the appropriate response to social media mentions quickly.
It allows companies to be more effective in timely messaging thanks to the ability for rapid response to a customer′s post in social media. This saves budget for companies who use social media for promoting and as a lead generation tool.

Amazon Web Services Diagrams diagramming tool for architecture
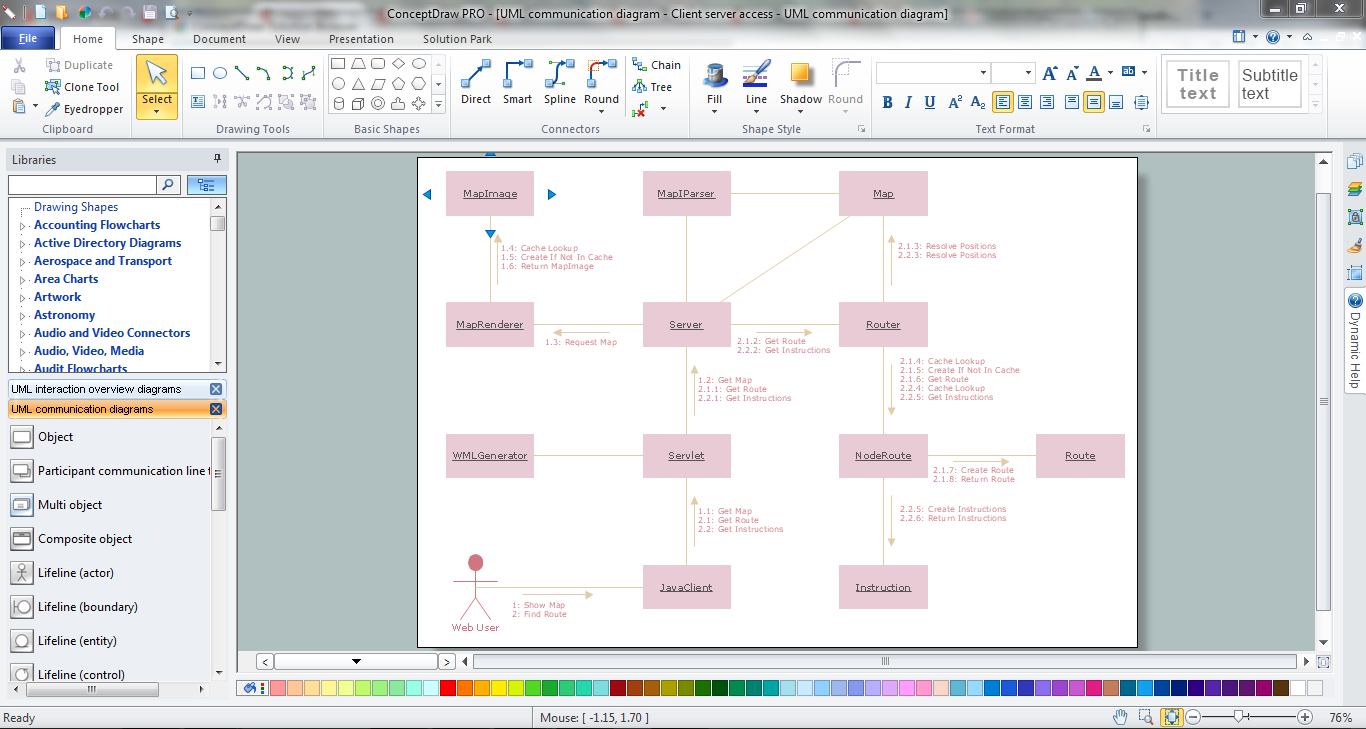
The AWS Architecture Diagrams solution includes icons, sample and templates for several Amazon Web Services products and resources, to be used when creating architecture diagrams. The icons are designed to be simple so that you can easily incorporate them in your diagrams and put them in your whitepapers, presentations, datasheets, posters or any technical material you like. Here you will find an official collection of AWS resources that will help you build great AWS Architecture diagrams.

Online Diagram Tool

ConceptDraw DIAGRAM diagramming and vector drawing software extended with Rapid UML Solution from the Software Development Area is a powerful online diagram tool that will help you design any types of UML diagrams simply and fast.

Entity Relationship Diagram - ERD - Software for Design Crows Foot ER Diagrams

Crow's Foot notation was proposed by Gordon Everest. According to this notation, the entity is represented by rectangle, relation is depicted by line which ties two entities involved in a relationship. Entity-relationship diagrams based on both Chen's and Crow's Foot notations, can be easily drawn using the ConceptDraw DIAGRAM ERD diagrams software tools for design element Crow's Foot and Chen from Entity-Relationship Diagram (ERD) solution.
How to Build an Entity Relationship Diagram (ERD)
HelpDesk

How to Draw the Different Types of Pie Charts

Using a Pie Chart, you can visually estimate the relative contribution that different data categories contribute to a whole value. The pie chart displays the statistics in a visual format. The main use of pie charts to show comparisons. The larger piece of the pie, the more the value of this value compared to the rest. Various applications of pie charts can be found in business and education. For business, pie charts can be used to compare the success or failure of the goods or services. They may also be used to display the business market share.
HelpDesk

How to Create a Timeline Diagram

A Timeline is a chart which displays a project plan schedule in chronological order. A Timeline is used in project management to depict project milestones and visualize project phases and show project progress. The graphic form of a timeline makes it easy to understand critical project milestones, such as the progress of a project schedule. Timelines are particularly useful for project scheduling or project management when accompanied with a Gantt chart. It captures the main of what the project will accomplish and how it will be done. making a project timeline is one of the most important skills a project manager needs have. Making comprehensive, accurate timelines allows you getting every project off in the best way. ConceptDraw DIAGRAM allows you to draw a timeline chart using a special library.
HelpDesk

How to Create a HR Process Flowchart

One of the useful tools of each HR specialist is an HR Process Flowchart. HR Flowchart renders step-by-step the process of Human Resource management in any organization. HR flowchart shows the flow of all HR processes, identifies and standardizes the list of mandatory documents required for the implementation of all HR procedures, including the recruiting process. Usually, the descriptions of entire HR processes in a company requires a big set of graphics documents. They must be regularly redrawn to maintain up to date. The best tool for this is ConceptDraw DIAGRAM - the best software to create process flow diagrams of various types. In conjunction with ConceptDraw HR flowchart solution, it delivers comprehensive tool-set for human resource management.

Simple Diagramming

Create flowcharts, org charts, floor plans, business diagrams and more with ConceptDraw DIAGRAM.

What is Interactive Flowcharts

Organizing and Selecting Social Media Response Messages.
Interactive Flowcharts can change the way one creates and organizes their social media response process.

ConceptDraw Solution Park ConceptDraw Solution Park

ConceptDraw Solution Park
ConceptDraw Solution Park collects graphic extensions, examples and learning materials

Example of DFD for Online Store (Data Flow Diagram)

Data flow diagrams (DFDs) reveal relationships among and between the various components in a program or system. DFDs are an important technique for modeling a system’s high-level detail by showing how input data is transformed to output results through a sequence of functional transformations.
Example of DFD for Online Store shows the Data Flow Diagram for online store and interactions between the Visitors, Customers and Sellers, as well as Website Information and User databases.
Steps to Creating a Sales Process Flow Chart