 Bar Graphs
The Bar Graphs solution enhances ConceptDraw PRO v10 functionality with templates, numerous professional-looking samples, and a library of vector stencils for drawing different types of Bar Graphs, such as Simple Bar Graph, Double Bar Graph, Divided Bar Graph, Horizontal Bar Graph, Vertical Bar Graph, and Column Bar Chart.
 ConceptDraw Solution Park
ConceptDraw Solution Park collects graphic extensions, examples and learning materials
HelpDesk
How to Create a Bar Chart in ConceptDraw PRO

HelpDesk
How to Draw a Divided Bar Chart in ConceptDraw PRO

 Divided Bar Diagrams
The Divided Bar Diagrams Solution extends the capabilities of ConceptDraw PRO v10 with templates, samples, and a library of vector stencils for drawing high impact and professional Divided Bar Diagrams and Graphs, Bar Diagram Math, and Stacked Graph.
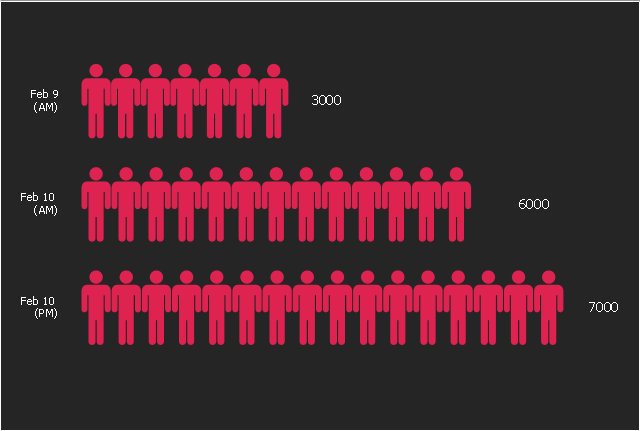
This picture bar graph sample shows increse in subscibers on YouTube to Anonymous' videos in 2008. It was designed on the base of the Wikimedia Commons file: A graph to show the increse in subscibers on YouTube to Anonymous' videos.jpg. [commons.wikimedia.org/ wiki/ File:A_ graph_ to_ show_ the_ increse_ in_ subscibers_ on_ YouTube_ to_ Anonymous%27_ videos.jpg]
This file is licensed under the Creative Commons Attribution 3.0 Unported license. [creativecommons.org/ licenses/ by/ 3.0/ deed.en]
"Anonymous (used as a mass noun) is a loosely associated international network of activist and hacktivist entities. A website nominally associated with the group describes it as "an internet gathering" with "a very loose and decentralized command structure that operates on ideas rather than directives". The group became known for a series of well-publicized publicity stunts and distributed denial-of-service (DDoS) attacks on government, religious, and corporate websites.
Anonymous originated in 2003 on the imageboard 4chan, representing the concept of many online and offline community users simultaneously existing as an anarchic, digitized global brain. Anonymous members (known as "Anons") can be distinguished in public by the wearing of stylised Guy Fawkes masks." [Anonymous (group). Wikipedia]
The pictorial chart example "The increse in subscibers on YouTube to Anonymous' videos" was created using the ConceptDraw PRO diagramming and vector drawing software extended with the Picture Graphs solution from the Graphs and Charts area of ConceptDraw Solution Park.
Image chart
 Picture Graphs
Typically, a Picture Graph has very broad usage. They many times used successfully in marketing, management, and manufacturing. The Picture Graphs Solution extends the capabilities of ConceptDraw PRO v10 with templates, samples, and a library of professionally developed vector stencils for designing Picture Graphs.
 Seven Basic Tools of Quality
Manage quality control in the workplace, using fishbone diagrams, flowcharts, Pareto charts and histograms, provided by the Seven Basic Tools of Quality solution.
HelpDesk
How to Draw a Pareto Chart Using ConceptDraw PRO

 Sales Dashboard
Sales Dashboard solution extends ConceptDraw PRO software with templates, samples and library of vector stencils for drawing the visual dashboards of sale metrics and key performance indicators (KPI).
 Line Graphs
How to draw a Line Graph with ease? The Line Graphs solution extends the capabilities of ConceptDraw PRO v10 with professionally designed templates, samples, and a library of vector stencils for drawing perfect Line Graphs.
 Event-driven Process Chain Diagrams
Event-driven Process Chain (EPC) Diagram is a type of flowchart widely used for modeling in business engineering and reengineering, business process improvement, and analysis. EPC method was developed within the Architecture of Integrated Information Systems (ARIS) framework.
- Graph Generator Online
- Bar Graphs
- ConceptDraw PROJECT Project Management Tool | PERT chart ...
- Graph Drawing Software Online
- Drawing Graphs Online
- Sales Growth. Bar Graphs Example | Online Collaboration via Skype ...
- Sales Growth. Bar Graphs Example | Bar Diagrams for Problem ...
- How to Draw a Divided Bar Chart in ConceptDraw PRO | Stacked ...
- Picture Graphs | Picture Graph | How to Create a Picture Graph in ...
- Sales Growth. Bar Graphs Example | Bar Chart Examples | Financial ...
- Bar Graphs | Sales Growth. Bar Graphs Example | How to Create a ...
- Bar Graphs | Bar Graph | Bar Chart Software | Bar Graph
- Bar graph - Serious Crime in Cincinnati | Column Chart Examples ...
- Bar Chart Template for Word | Column Chart Template | Chart Maker ...
- Chart Maker for Presentations | Picture Graphs | Chart Software for ...
- Bar Graphs | Line Graphs | Picture Graphs | Graphs
- Barrie population - Picture bar graph | Picture graphs - Vector ...
- Chart Maker for Presentations | Bar Graphs | Column Chart Software ...
- Chart Maker for Presentations | Sales Growth. Bar Graphs Example ...
- Image chart - The total financing of the Philippines from 2001-2010 ...