 Bar Graphs
The Bar Graphs solution enhances ConceptDraw DIAGRAM functionality with templates, numerous professional-looking samples, and a library of vector stencils for drawing different types of Bar Graphs, such as Simple Bar Graph, Double Bar Graph, Divided Bar Graph, Horizontal Bar Graph, Vertical Bar Graph, and Column Bar Chart.
Business diagrams & Org Charts with ConceptDraw DIAGRAM
The business diagrams are in great demand, they describe the business processes, business tasks and activities which are executed to achieve specific organizational and business goals, increase productivity, reduce costs and errors. They let research and better understand the business processes. ConceptDraw DIAGRAM is a powerful professional cross-platform business graphics and business flowcharting tool which contains hundreds of built-in collections of task-specific vector stencils and templates. They will help you to visualize and structure information, create various Business flowcharts, maps and diagrams with minimal efforts, and add them to your documents and presentations to make them successful. Among them are Data flow diagrams, Organization charts, Business process workflow diagrams, Audit flowcharts, Cause and Effect diagrams, IDEF business process diagrams, Cross-functional flowcharts, PERT charts, Timeline diagrams, Calendars, Marketing diagrams, Pyramids, Target diagrams, Venn diagrams, Comparison charts, Analysis charts, Dashboards, and many more. Being a cross-platform application, ConceptDraw DIAGRAM is very secure, handy, free of bloatware and one of the best alternatives to Visio for Mac users.
 Divided Bar Diagrams
The Divided Bar Diagrams Solution extends the capabilities of ConceptDraw DIAGRAM with templates, samples, and a library of vector stencils for drawing high impact and professional Divided Bar Diagrams and Graphs, Bar Diagram Math, and Stacked Graph.
HelpDesk
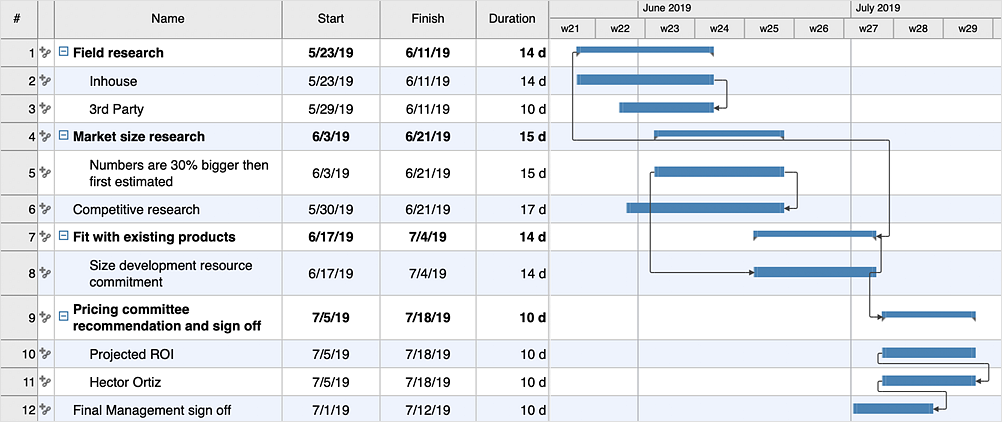
How to Create a Gantt Chart for Your Project
Instruction on how to create Gantt chart using ConceptDraw PROJECT software. Gant Chart is a graphical representation of tasks as segments on a time scale. It helps plan or overlapping.HelpDesk
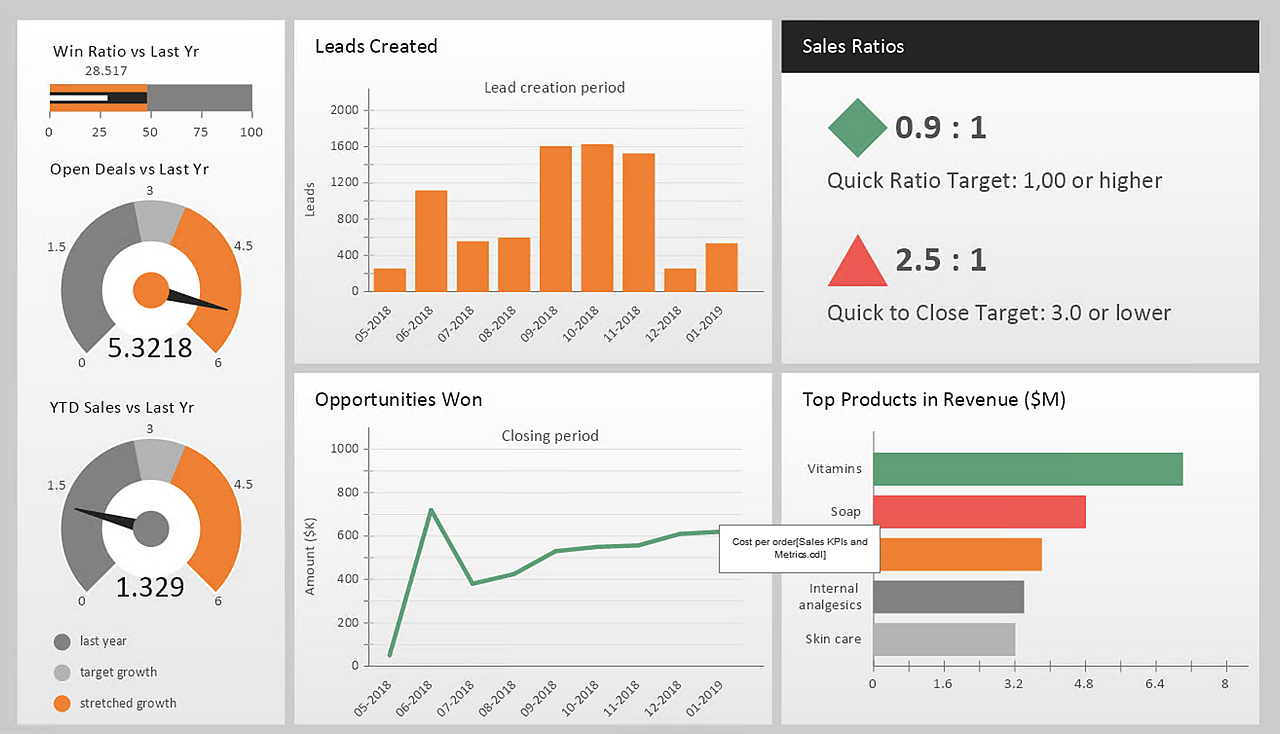
How to Create a Sales Dashboard
A visual dashboard is a valuable tool for any sales team. Sales dashboard allows you to view and monitor sales indicators that are important for manager and sales staff. It helps to use timely and reliable information to improve the quality of sales performance and increase sales revenues. ConceptDraw Sales Dashboard solution is a tool for both: sales manager and sales team. It provides the visualization of key performance indicators that are critical to the entire sales organization. The custom sales dashboard displays real-time information on sales performance KPIs with the help of intuitive and easy-to-understand diagrams and charts.HelpDesk
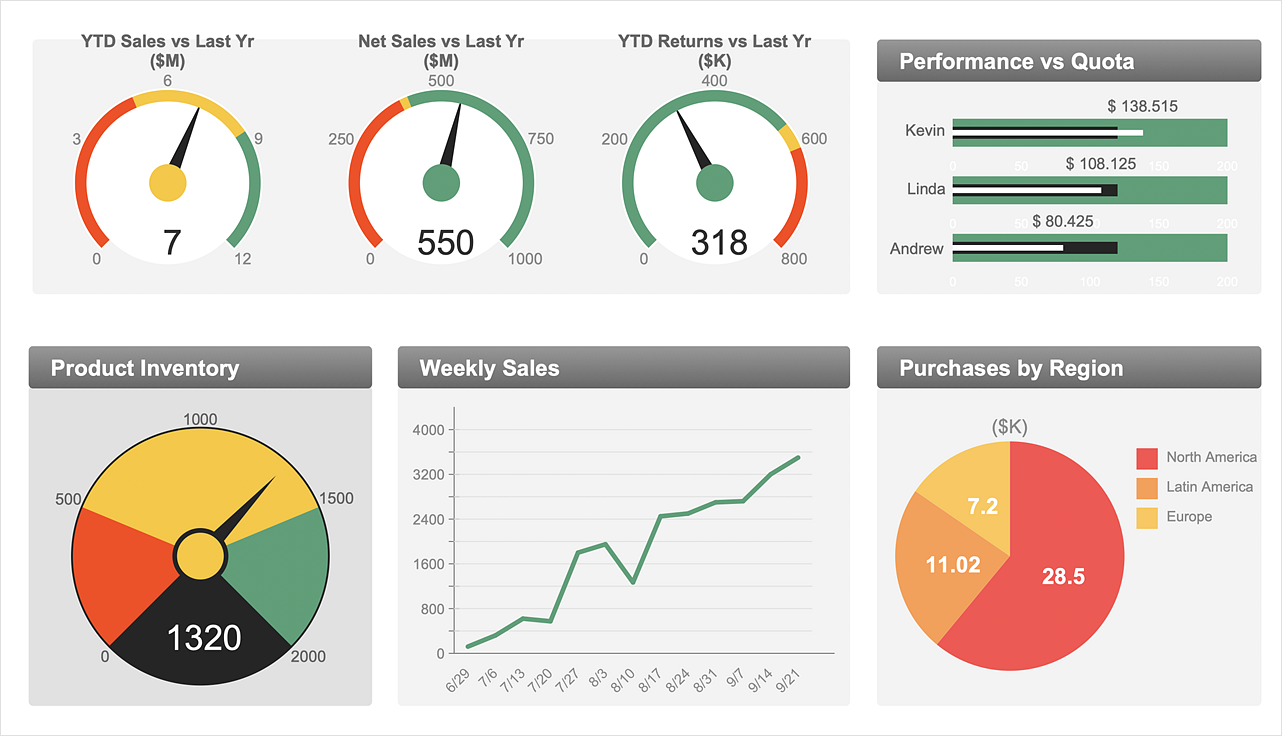
How to Use ConceptDraw Sales Dashboard Solution
An interactive visual dashboard is a valuable tool for any sales team. Sales dashboard allows you to view and monitor sales indicators that are important for manager and sales staff. It helps to use timely and reliable information to improve the quality of sales performance and increase sales revenues. ConceptDraw Sales Dashboard solution is a tool for both: sales manager and sales team. It provides the visualization of key performance indicators that are critical to the entire sales organization. The custom sales dashboard displays real-time information on sales performance KPIs with the help of intuitive and easy-to-understand diagrams and charts. Sales Dashboard helps the entire team see where they are, and what needs to be done. With ConceptDraw DIAGRAM you can easily create a visual Sales Dashboard using Live Objects Technology.- Bar Chart Online
- Chart Maker Flowchart Software
- Flow Chart Creator
- Bar Chart Software | In searching of alternative to MS Visio for MAC ...
- Mind Map Exchange | Online Collaboration via Skype | Sales ...
- Bar Chart Software | Pie Chart Software | Bubble Chart Maker | Easy ...
- What Is A Flow Chat With The Aid Of Diagram
- Sales Growth. Bar Graphs Example | Bar Diagrams for Problem ...
- Bar Chart Software | Bar Chart Examples | How to Create a Bar ...
- Sales Growth. Bar Graphs Example | Bar Chart Examples | Financial ...
- Online Result Software Diagram
- ConceptDraw PROJECT Project Management Tool | PERT chart ...
- Bar Graphs
- Online Collaboration via Skype | Sales Growth. Bar Graphs Example ...
- Flow Chart Online | Online Flow Chart | How to Create a Timeline ...
- Sales Growth. Bar Graphs Example | Bar Diagrams for Problem ...
- How To Create a PERT Chart | Flow Chart Online | How to Draw the ...
- Divided bar diagram - Template | Chart Software for Better ...
- Bar Chart Software | Line Chart Template for Word | Chart Maker for ...
- Flow Chart Online | ConceptDraw Solution Park | How To Create a ...


