"Consumption of energy resources, (e.g. turning on a light) requires resources and has an effect on the environment. Many electric power plants burn coal, oil or natural gas in order to generate electricity for energy needs. While burning these fossil fuels produces a readily available and instantaneous supply of electricity, it also generates air pollutants including carbon dioxide (CO2), sulfur dioxide and trioxide (SOx) and nitrogen oxides (NOx). Carbon dioxide is an important greenhouse gas which is thought to be responsible for some fraction of the rapid increase in global warming seen especially in the temperature records in the 20th century, as compared with tens of thousands of years worth of temperature records which can be read from ice cores taken in Arctic regions. Burning fossil fuels for electricity generation also releases trace metals such as beryllium, cadmium, chromium, copper, manganese, mercury, nickel, and silver into the environment, which also act as pollutants.
The large-scale use of renewable energy technologies would "greatly mitigate or eliminate a wide range of environmental and human health impacts of energy use". Renewable energy technologies include biofuels, solar heating and cooling, hydroelectric power, solar power, and wind power. Energy conservation and the efficient use of energy would also help." [Energy industry. Environmental impact. Wikipedia]
The Energy resources diagram example was created in the ConceptDraw PRO diagramming and vector drawing software using the Manufacturing and Maintenance solution from the Illustration area of ConceptDraw Solution Park.
Infographics

 Pie Charts
Pie Charts are extensively used in statistics and business for explaining data and work results, in mass media for comparison (i.e. to visualize the percentage for the parts of one total), and in many other fields. The Pie Charts solution for ConceptDraw PRO v10 offers powerful drawing tools, varied templates, samples, and a library of vector stencils for simple construction and design of Pie Charts, Donut Chart, and Pie Graph Worksheets.
 Divided Bar Diagrams
The Divided Bar Diagrams Solution extends the capabilities of ConceptDraw PRO v10 with templates, samples, and a library of vector stencils for drawing high impact and professional Divided Bar Diagrams and Graphs, Bar Diagram Math, and Stacked Graph.
Pyramid Diagram

The vector stencils library "Resources and energy" contains 19 clipart images for drawing illustrations on resources and energy.
"Natural resources occur naturally within environments that exist relatively undisturbed by humanity, in a natural form. A natural resource is often characterized by amounts of biodiversity and geodiversity existent in various ecosystems.
Natural resources are derived from the environment. Some of them are essential for our survival while most are used for satisfying our wants. Natural resources may be further classified in different ways.
Natural resources are materials and components (something that can be used) that can be found within the environment. Every man-made product is composed of natural resources (at its fundamental level). A natural resource may exist as a separate entity such as fresh water, and air, as well as a living organism such as a fish, or it may exist in an alternate form which must be processed to obtain the resource such as metal ores, oil, and most forms of energy." [Natural resource. Wikipedia]
The clip art example "Resources and energy - Vector stencils library" was created in ConceptDraw PRO diagramming and vector drawing software using the Manufacturing and Maintenance solution from the Illustration area of ConceptDraw Solution Park.
Human resources

Batteries

Wind turbine

Transmission tower

Natural gas burner

Solar panel

Lightning

Ionizing radiation hazard sign

High voltage symbol

Atom

Incandescent light bulb

Oil barrels

Power station

Wood

Perpetuum mobile

Hydroelectric dam

Liquefied petroleum gas

Natural gas

Minecart with coal

Types of Flowcharts


This cycle diagram sample was created on the base of the figure illustrating the article "Environmental Materials" by Cris Arnold from the website of the UK Centre for Materials Education of the Higher Education Academy. "The figure ... schematically shows how the disparate areas under the heading of 'environmental materials' can be linked via a life cycle analysis approach. ...
Life Cycle Analysis.
Life Cycle Analysis is essentially a method of considering the entire environmental impact, energy and resource usage of a material or product. It is often known as a 'cradle-to-grave' analysis and can encompass the entire lifetime from extraction to end-of-life disposal. Life cycle analysis can be an extremely effective way of linking many different aspects of the environmental impacts of materials usage. ...
Materials Extraction and Resource Implications.
The environmental impact of raw materials extraction and processing together with global resource issues provides a good place to start consideration of environmental aspects of materials. ...
Environmental Impacts of Processing.
... Topics that would come under this subject area include the specific environmental problems associated with processing of metals, polymers, ceramics, composites etc, and how these problems can be overcome.
Design for Sustainability.
This area ... will ... cover issues such as design for successful recycling, waste minimisation, energy efficiency and increased lifetime.
Economic, Social and Legislative Issues.
... For example, materials selection within the automotive industry is now heavily influenced by 'end-of-life vehicle' and 'hazardous material' regulations.
Use of Sustainable Materials.
... It is probably sensible to define such materials as those that have distinct differences that achieve environmental benefit compared to conventional materials. With this definition, the list would include:
(1) Materials of a significantly plant-based nature, including wood, natural fibre composites, natural polymers.
(2) Materials produced using a large proportion of waste material, including recycled polymers, composites made from waste mineral powders, and arguably also much steel and aluminium.
Materials for Green Energy.
The most exciting developments in Materials Science are in the realm of functional materials, and many of these serve an environmentally-beneficial purpose, particularly in the production of green energy.
These include:
(1) Solar-cell materials.
(2) Fuel-cell technology.
(3) Catalytic pollution control.
End-of-Life Issues.
The treatment of materials at the end of their lifetime is a significant subject area and encompasses aspects such as recycling techniques and materials limitations, biodegradabilty and composting, chemical recovery and energy recovery." [materials.ac.uk/ guides/ environmental.asp]
The ring chart example "Life cycle analysis" was created using the ConceptDraw PRO diagramming and vector drawing software extended with the Target and Circular Diagrams solution from the Marketing area of ConceptDraw Solution Park.
www.conceptdraw.com/ solution-park/ marketing-target-and-circular-diagrams
Ring chart

Cisco Products Additional. Cisco icons, shapes, stencils and symbols
")
Chemical Engineering

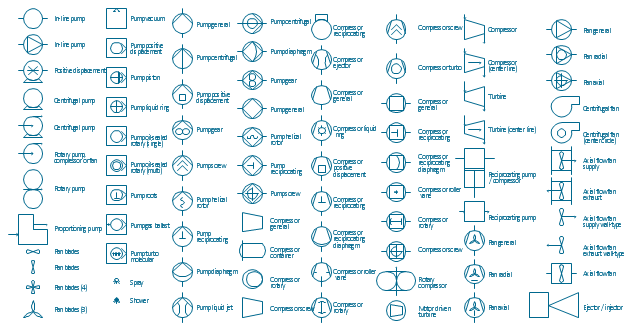
The vector stencils library "Pumps" contains 82 symbols of pumps, compressors, fans, turbines, and power generators.
Use these icons to design pumping systems, air and fluid compression systems, and industrial process diagrams.
"A pump is a device that moves fluids (liquids or gases), or sometimes slurries, by mechanical action. Pumps can be classified into three major groups according to the method they use to move the fluid: direct lift, displacement, and gravity pumps.
Pumps operate by some mechanism (typically reciprocating or rotary), and consume energy to perform mechanical work by moving the fluid. Pumps operate via many energy sources, including manual operation, electricity, engines, or wind power, come in many sizes, from microscopic for use in medical applications to large industrial pumps.
Mechanical pumps serve in a wide range of applications such as pumping water from wells, aquarium filtering, pond filtering and aeration, in the car industry for water-cooling and fuel injection, in the energy industry for pumping oil and natural gas or for operating cooling towers. In the medical industry, pumps are used for biochemical processes in developing and manufacturing medicine, and as artificial replacements for body parts, in particular the artificial heart and penile prosthesis.
In biology, many different types of chemical and bio-mechanical pumps have evolved, and biomimicry is sometimes used in developing new types of mechanical pumps." [Pump. Wikipedia]
The example "Design elements - Pumps" was created using the ConceptDraw PRO diagramming and vector drawing software extended with the Chemical and Process Engineering solution from the Engineering area of ConceptDraw Solution Park.
Pump symbols
Electrical Symbols — Stations

 Picture Graphs
Typically, a Picture Graph has very broad usage. They many times used successfully in marketing, management, and manufacturing. The Picture Graphs Solution extends the capabilities of ConceptDraw PRO v10 with templates, samples, and a library of professionally developed vector stencils for designing Picture Graphs.
Chemistry Drawings

Scatter Chart Examples

Chart Templates

- Energy resources diagram | Determine groundwater - IDEF0 ...
- Process Flowchart | Energy resources diagram | Types of Flowcharts ...
- Resources and energy - Vector stencils library | Energy resources ...
- Determine groundwater - IDEF0 diagram | Energy resources ...
- Resources and energy - Vector stencils library | Energy Pyramid ...
- Energy resources diagram | Path to sustainable development ...
- Energy resources diagram | Chart On Conservation Of Natural ...
- Energy resources diagram | Resources and energy - Vector stencils ...
- Resources and energy - Vector stencils library | Energy resources ...
- Energy Pyramid Diagram | Energy resources diagram | U.S. energy ...
- Energy resources diagram | LLNL Flow Charts | Energy Pyramid ...
- Resources and energy - Vector stencils library | Energy resources ...
- Energy resources diagram | CMP adaptive management cycle ...
- Energy resources diagram | Cross Functional Flowchart Symbols ...
- Energy resources diagram | Manufacturing and Maintenance ...
- Circular Arrows Diagrams | Energy resources diagram | Chart ...
- Vector Map of Germany | Manufacturing and Maintenance | Energy ...
- How To Create Restaurant Floor Plan in Minutes | Energy resources ...
- Resources and energy - Vector stencils library | HVAC Business ...
- Determine groundwater - IDEF0 diagram | Energy resources ...