How to Design a Good Workflow
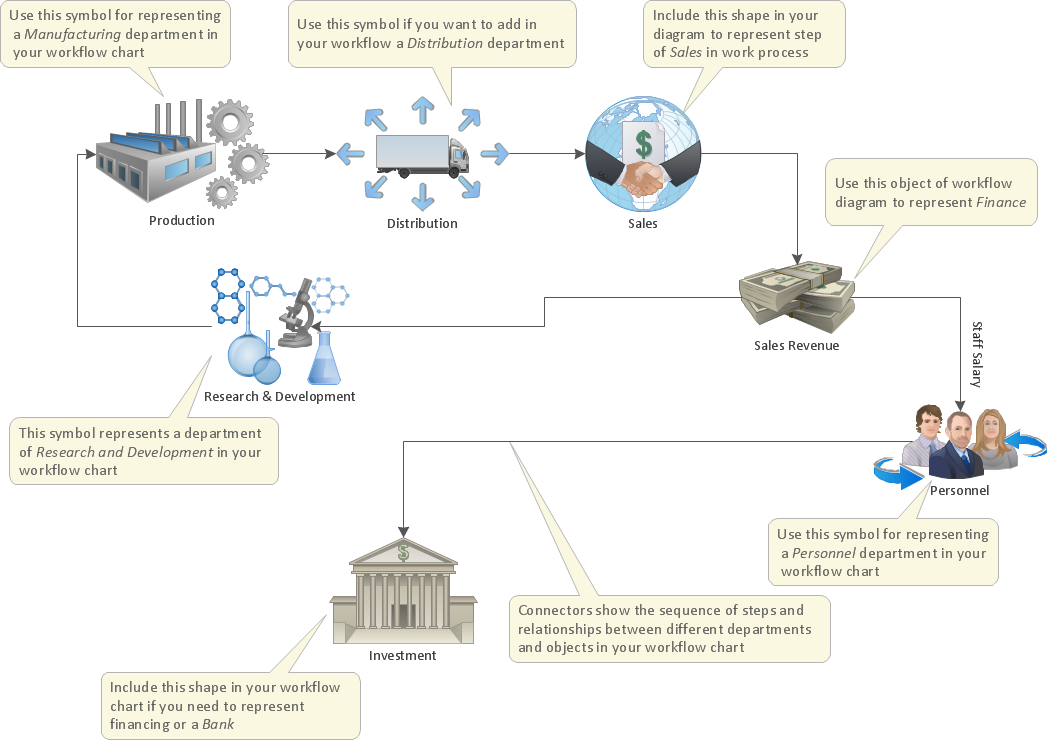
To design a good workflow you have to focus on process analysis, not using the a drawing tool. This is more possible with ConceptDraw PRO software that brings the most natural drawing manner you have ever tried. First, define steps and procedures using simple rectangle shape, then select all shapes and click the Chain button to connect all shapes just in one click. After that you are able to modify some relations if needed.UK Map
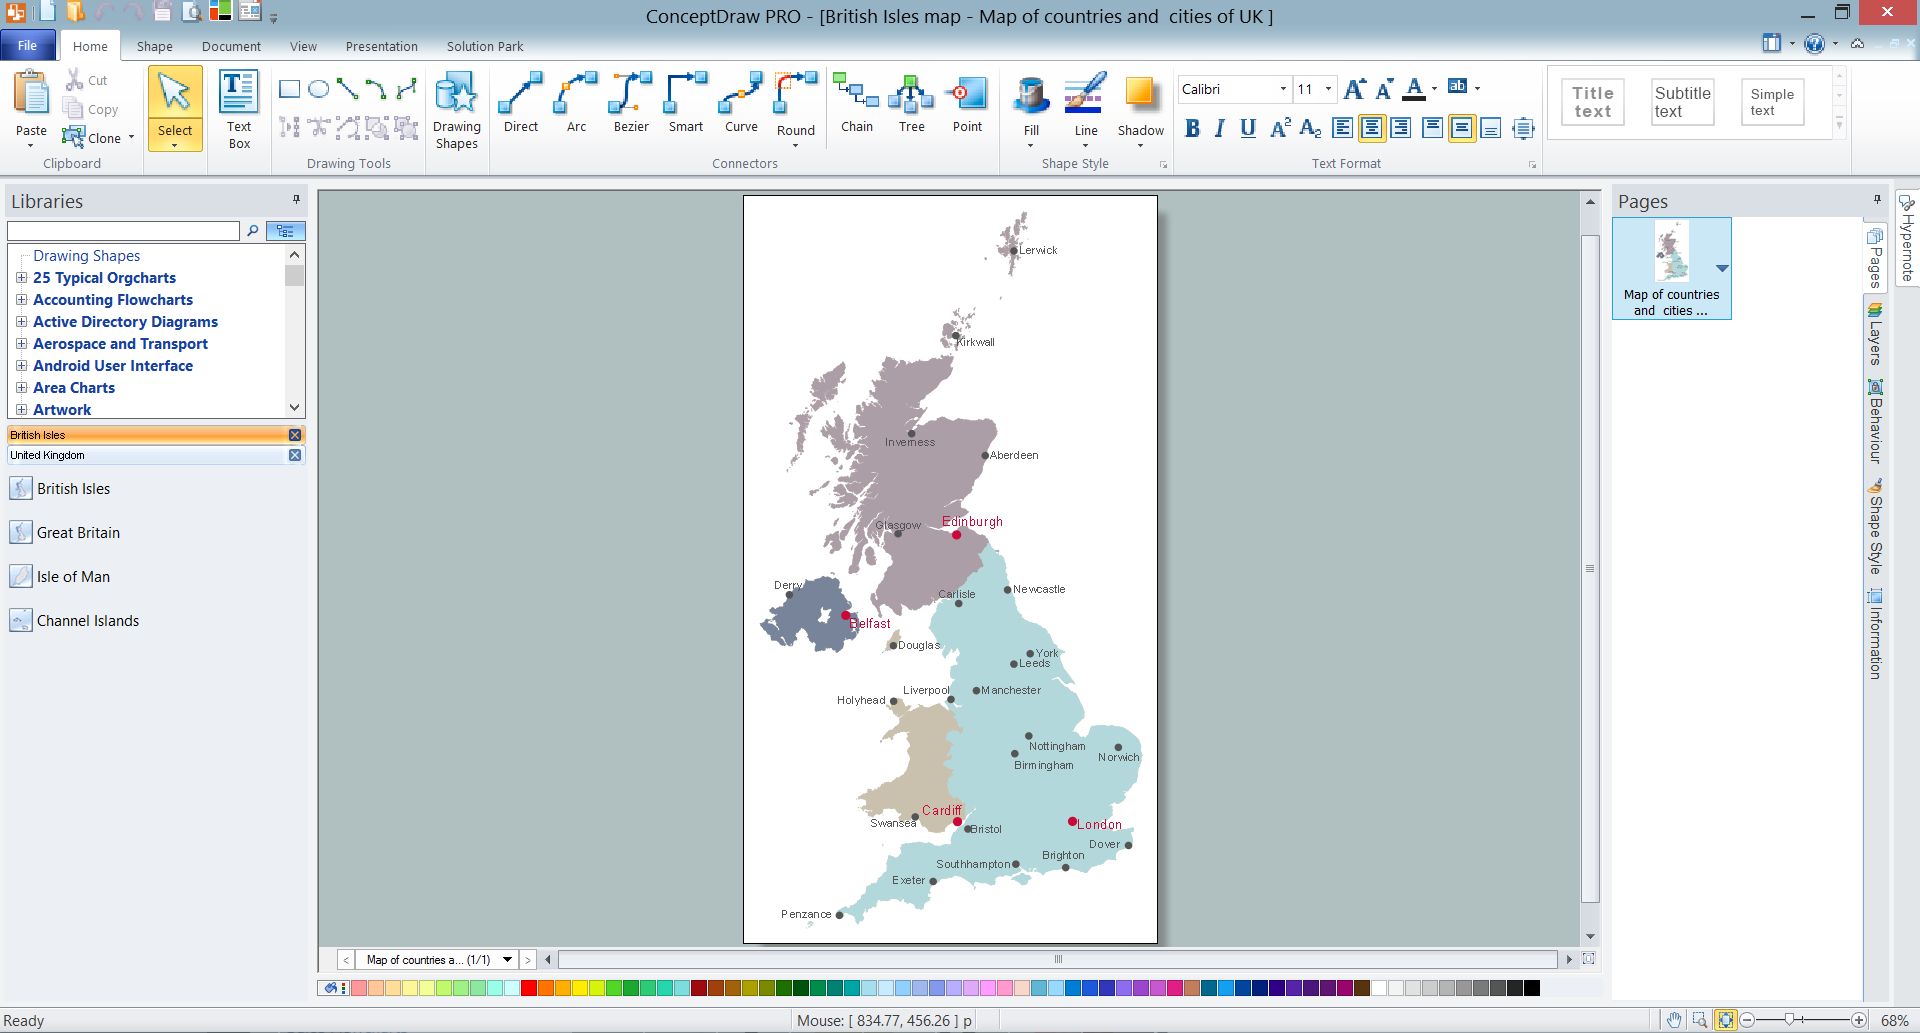
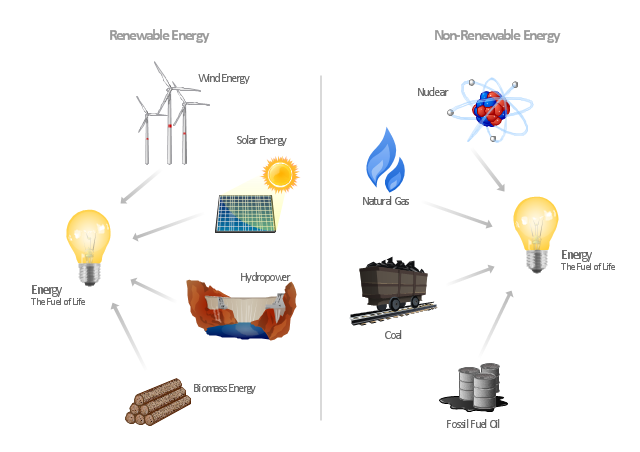
The United Kingdom of Great Britain and Northern Ireland, commonly known as the United Kingdom (UK), is a sovereign state in Europe which consists of four countries: England, Scotland, Wales, and Northern Ireland. UK is surrounded by the waters of Atlantic ocean, the North Sea, the English Channel, and the Irish Sea and includes large number of big and small islands. ConceptDraw PRO diagramming and vector drawing software offers the unique Map of UK Solution from the Maps Area of ConceptDraw Solution Park that is indispensable for easy drawing professional looking map of UK, UK counties map, UK map with cities, map of Scotland, map of England, map of Wales, Northern Ireland map."Consumption of energy resources, (e.g. turning on a light) requires resources and has an effect on the environment. Many electric power plants burn coal, oil or natural gas in order to generate electricity for energy needs. While burning these fossil fuels produces a readily available and instantaneous supply of electricity, it also generates air pollutants including carbon dioxide (CO2), sulfur dioxide and trioxide (SOx) and nitrogen oxides (NOx). Carbon dioxide is an important greenhouse gas which is thought to be responsible for some fraction of the rapid increase in global warming seen especially in the temperature records in the 20th century, as compared with tens of thousands of years worth of temperature records which can be read from ice cores taken in Arctic regions. Burning fossil fuels for electricity generation also releases trace metals such as beryllium, cadmium, chromium, copper, manganese, mercury, nickel, and silver into the environment, which also act as pollutants.
The large-scale use of renewable energy technologies would "greatly mitigate or eliminate a wide range of environmental and human health impacts of energy use". Renewable energy technologies include biofuels, solar heating and cooling, hydroelectric power, solar power, and wind power. Energy conservation and the efficient use of energy would also help." [Energy industry. Environmental impact. Wikipedia]
The Energy resources diagram example was created in the ConceptDraw PRO diagramming and vector drawing software using the Manufacturing and Maintenance solution from the Illustration area of ConceptDraw Solution Park.
Work Flow Process Chart
Workflow Diagram - workflow process diagram is a visual representation of a organizational process flow. Often it used as the same visual notation as process flow diagram. Visualising business processes using workflow diagram (workflow process diagram) allows estimate business process efficiency, analyse and optimize the process itself. Workflow diagram helps get focusing on each step and relations between workflow steps. ConceptDraw PRO is software for making workflow diagram. It contains specific designed graphics to draw workflow diagrams effectively. This is workflow diagram maker which do your work process effective.Process Diagrams
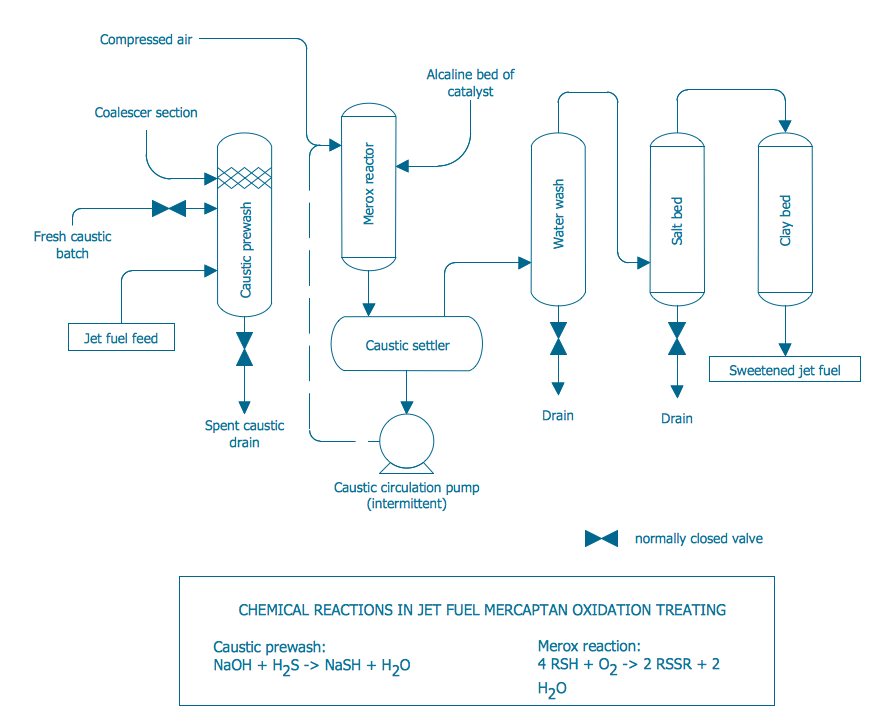
ConceptDraw PRO diagramming and vector drawing software extended with Chemical and Process Engineering Solution from the Engineering Area of ConceptDraw Solution Park offers you the set of useful tools for easy drawing various Process Diagrams.Computer Network Architecture. Computer and Network Examples
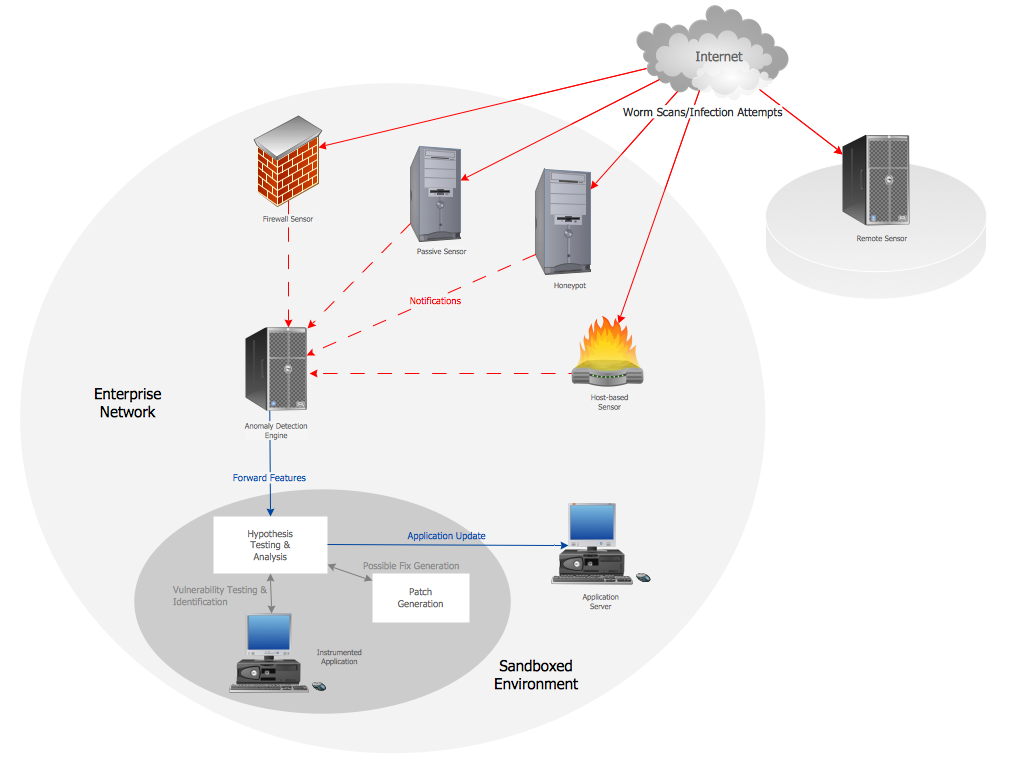
The network architecture and design specialization will help you gain the technical leadership skills you need to design and implement high-quality networks that support business needs.
Optimize a Workflow
The first step to optimize a workflow is to get its visual depiction. Then you can analyse and optimize the workflow making changes to your workflow diagram. We recommend to use ConceptDraw PRO software extended with the Workflow Diagram solution to visualize and optimize your workflow. It allows you produce easy-to-change scalable vector graphic workflow and then present it to your team or partners.Drawing Workflow Diagrams
Drawing workflow diagrams combines both creative and analytic practice. To be the most effective in this process you should find a software that suites this kind of practice. Using ConceptDraw PRO software for drawing workflow diagrams you get support of features, libraries, templates and samples boosts you creativity and keep you focus on analytic practice, not drawing specifics.How to Draw a Natural Landscape
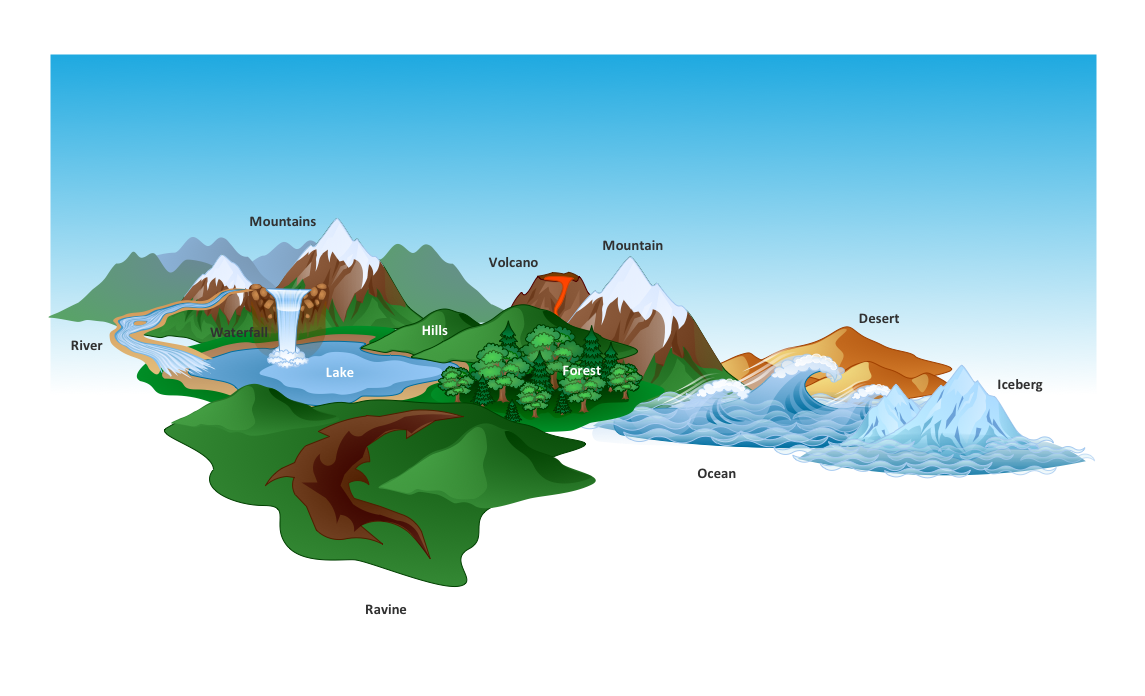
Nature solution expands ConceptDraw PRO software with samples, templates and libraries of vector clip art for drawing of Nature illustrations. Use Geography library of vector stencils to draw natural landscapes.Bar Diagram Math
ConceptDraw PRO extended with Divided Bar Diagrams solution from Graphs and Charts area of ConceptDraw Solution Park is the best software for quick and simple drawing the Divided Bar Diagrams and Bar Diagram Math.How to Draw a Good Diagram of a Business Workflow?
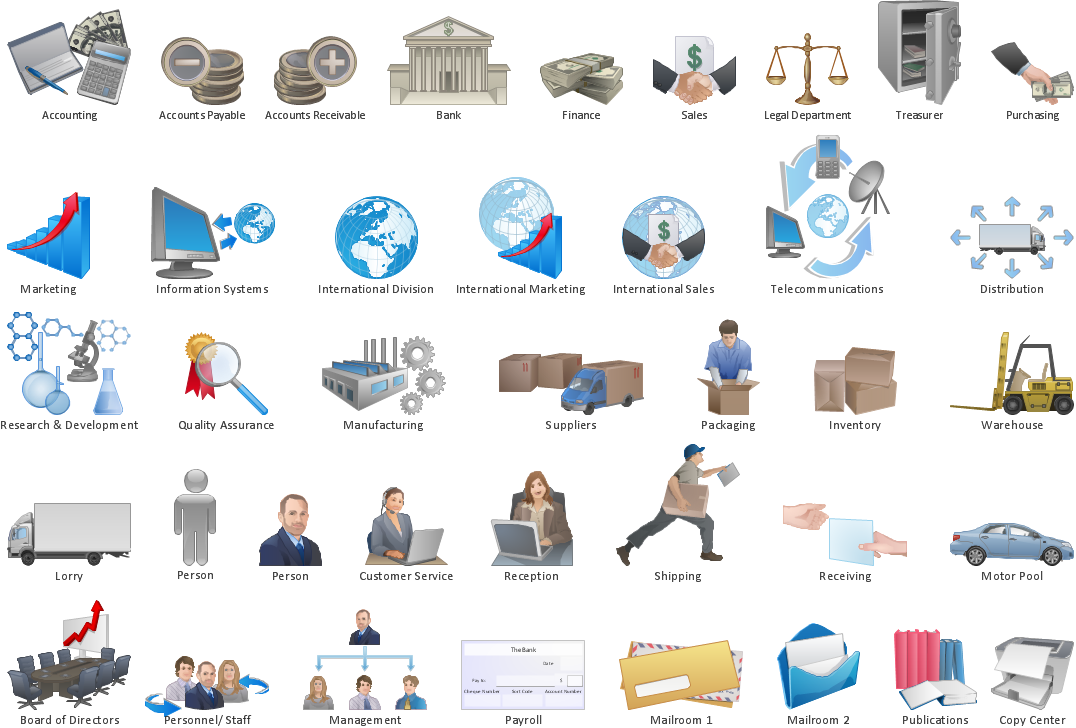
To draw a good diagram of a business workflow you should have a ready-to-use set of pre-designed objects you may drag-and-drop to your document focusing on the workflow structure and meaning, not drawing tools. ConceptDraw PRO with Workflow Diagrams solution provides complete set of design element you may use to draw a good diagram of a business workflow.How to Draw Workflow Diagram
To draw workflow diagram you should find a perfect software first. We recommend using ConceptDraw PRO software contains all features you may need to draw diagrams faster. ConceptDraw PRO software extended with the Workflow Diagrams solution gives you everything you need to draw workflow diagram.Affinity Diagram
The Affinity Diagram, also known as a KJ diagram, is a business tool invented for organization the large quantity of ideas and data. It is a part of Seven Management and Planning Tools, it is usually used right after brainstorming to sort large numbers of ideas into the corresponding groups. The Affinity Diagram helps to represent in a better way the structure of large and complex factors which influence on a problem, divides these factors into the smaller and simpler structures, and helps team members to see the patterns and identify possible solutions to problems they have. The diagrams of this type don't show the causal relationships between the factors, but they are designed to prepare the data for holding further analysis of the cause-effect relationships. Another area of Affinity Diagram usage is contextual inquiry as a way to sort observations and notes from field interviews, support call logs, open-ended survey responses organizing, etc. ConceptDraw MINDMAP software offers you the tools for easy holding brainstorming, generation ideas and creation MINDMAP Affinity Diagram.Affinity Diagram
The affinity diagram is a business tool used to organize ideas and data. It is one of the Seven Management and Planning Tools. But how design the Affinity Diagram quick and easy? ConceptDraw PRO diagramming and vector drawing software offers the Seven Management and Planning Tools Solution from the Management Area.Control and Information Architecture Diagrams (CIAD) with ConceptDraw PRO
One of the three main constituents of any enterprise is the Control and Information Architecture. The rest two are Production facilities and People and Organization.- Chart On Availability Conservation And Uses Of Natural Resources
- Diagram Related To Natural Resources
- Natural Resources Diagram
- Diagrams On Natural Resources
- Natural Resources And Human Resources Diagram
- Natural Resources Diagrams
- Resources and energy - Vector stencils library | Energy resources ...
- Natural Resources Eazy Drawing
- Energy Pyramid Diagram | Resources and energy - Vector stencils ...
- Images Of Natural Resource Management Related To Math
- Natural Resources Pie Chart
- Examples Of Natural Resources Graph Pic
- How To Start Natural Resource Using Diagram
- Management Of Natural Resource In Mathematics Pie Chart
- Natural Resource Diagrams Images And Graphs
- Natural Resources Pie Chart Graphs
- Management Of Natural Resource Mathe Project
- Pie Charts | Bar Diagram Math | UK Map | Natural Resources Pie ...
- Energy resources diagram | Pie Charts | Divided Bar Diagrams ...
