Geo Map - USA - Illinois

"Consumption of energy resources, (e.g. turning on a light) requires resources and has an effect on the environment. Many electric power plants burn coal, oil or natural gas in order to generate electricity for energy needs. While burning these fossil fuels produces a readily available and instantaneous supply of electricity, it also generates air pollutants including carbon dioxide (CO2), sulfur dioxide and trioxide (SOx) and nitrogen oxides (NOx). Carbon dioxide is an important greenhouse gas which is thought to be responsible for some fraction of the rapid increase in global warming seen especially in the temperature records in the 20th century, as compared with tens of thousands of years worth of temperature records which can be read from ice cores taken in Arctic regions. Burning fossil fuels for electricity generation also releases trace metals such as beryllium, cadmium, chromium, copper, manganese, mercury, nickel, and silver into the environment, which also act as pollutants.
The large-scale use of renewable energy technologies would "greatly mitigate or eliminate a wide range of environmental and human health impacts of energy use". Renewable energy technologies include biofuels, solar heating and cooling, hydroelectric power, solar power, and wind power. Energy conservation and the efficient use of energy would also help." [Energy industry. Environmental impact. Wikipedia]
The Energy resources diagram example was created in the ConceptDraw PRO diagramming and vector drawing software using the Manufacturing and Maintenance solution from the Illustration area of ConceptDraw Solution Park.
Infographics

ConceptDraw DIAGRAM Compatibility with MS Visio

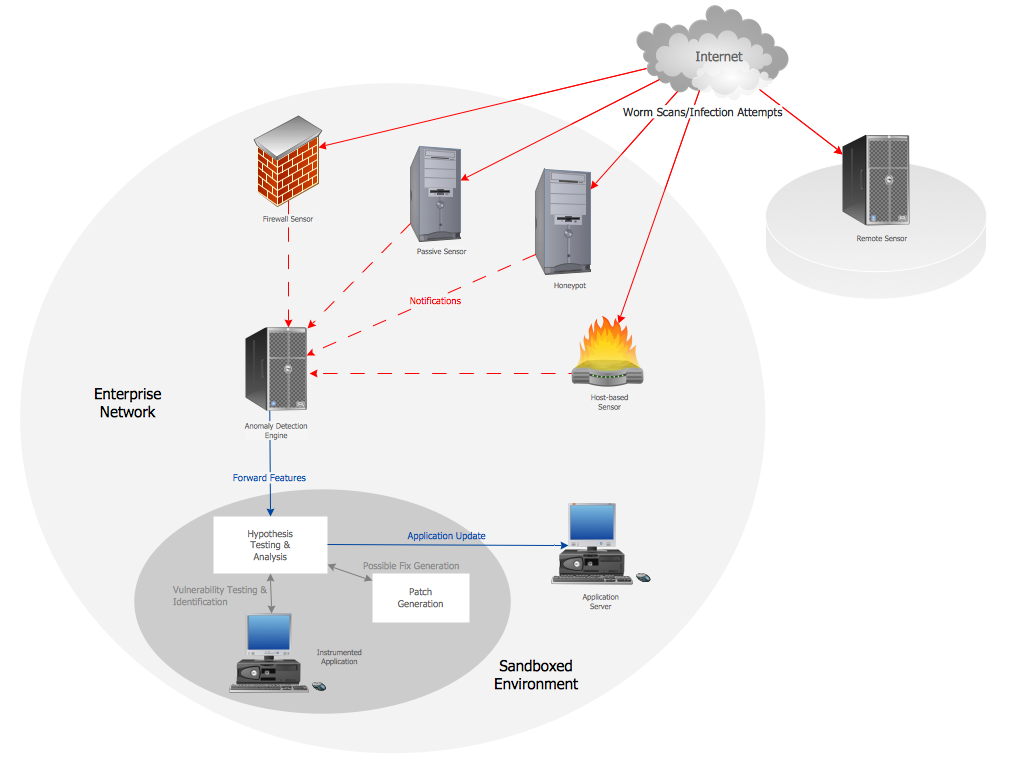
Computer Network Architecture. Computer and Network Examples

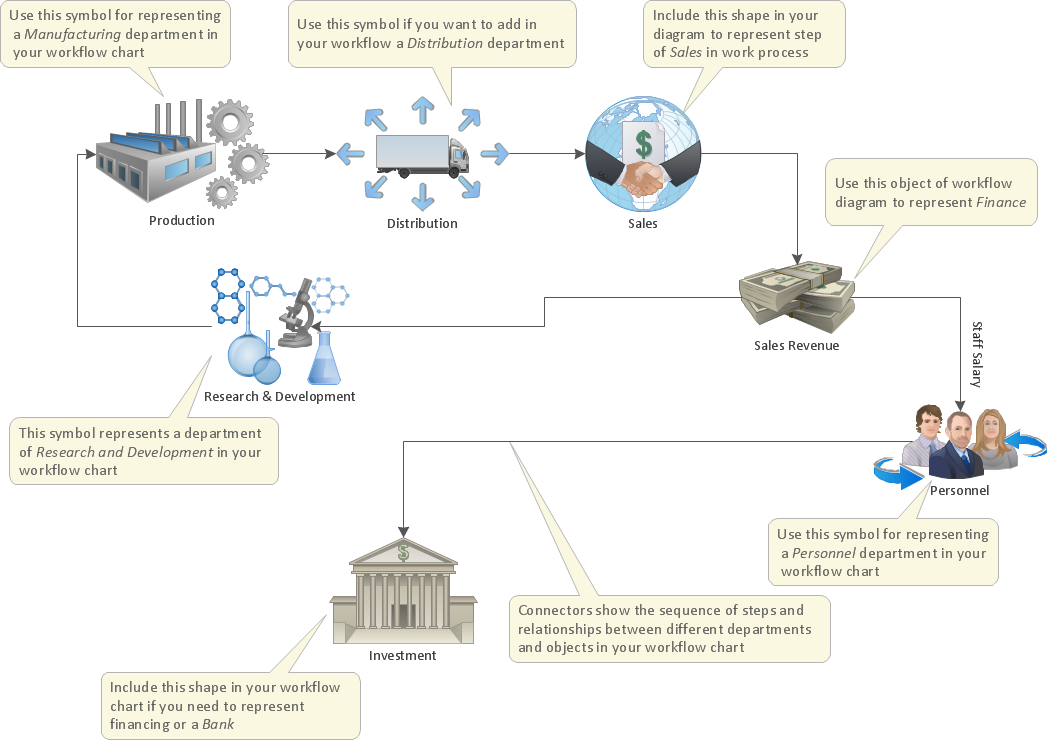
How to Design a Good Workflow

Optimize a Workflow
This Venn diagram sample depicts the path to sustainable development.
"Sustainable development is an organizing principle for human life on a finite planet. It posits a desirable future state for human societies in which living conditions and resource-use meet human needs without undermining the sustainability of natural systems and the environment, so that future generations may also have their needs met.
Sustainable development ties together concern for the carrying capacity of natural systems with the social and economic challenges faced by humanity. As early as the 1970s, 'sustainability' was employed to describe an economy "in equilibrium with basic ecological support systems." Scientists in many fields have highlighted The Limits to Growth, and economists have presented alternatives, for example a 'steady state economy', to address concerns over the impacts of expanding human development on the planet." [Sustainable development. Wikipedia]
The Venn diagram example "Path to sustainable development" was created using the ConceptDraw PRO diagramming and vector drawing software extended with the Venn Diagrams solution from the area "What is a Diagram" of ConceptDraw Solution Park.
Venn diagram

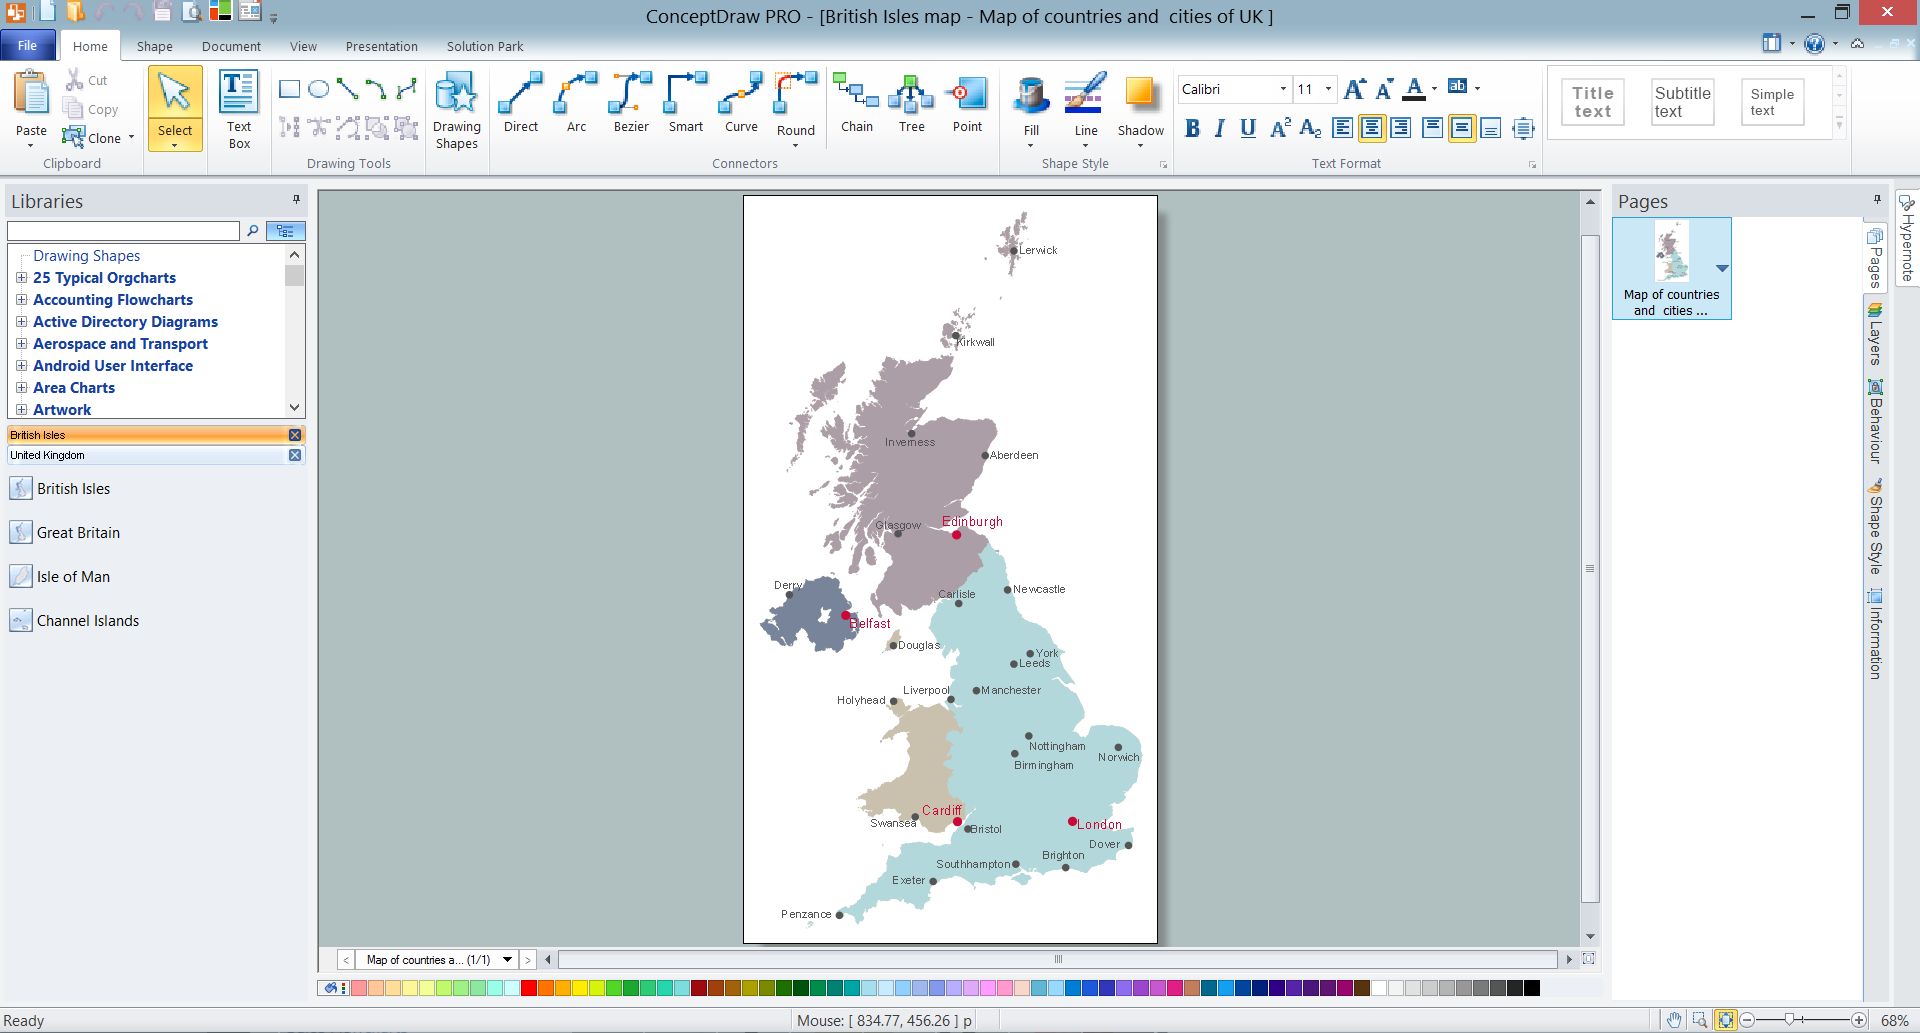
 UK Map
The Map of UK solution contains collection of professionally designed samples and scalable vector stencil graphics maps, representing the United Kingdom counties, regions and cities. Use the Map of UK solution from ConceptDraw Solution Park as the base fo
UK Map
How to Draw a Good Diagram of a Business Workflow?

Geo Map - Asia - Philippines

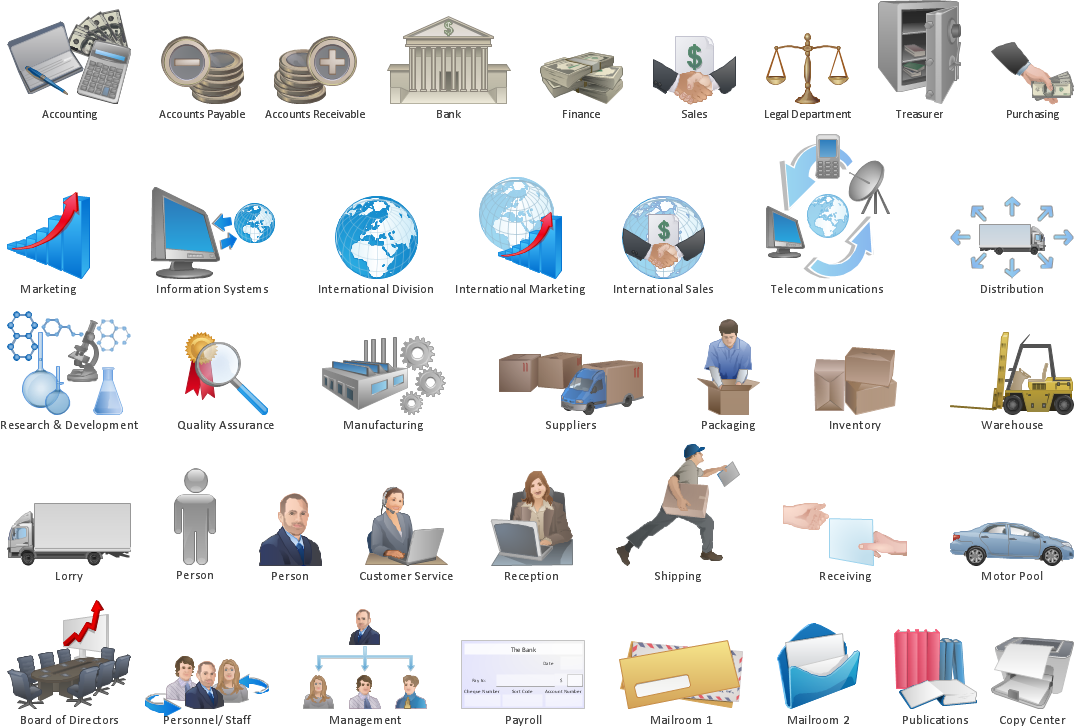
The vector stencils library "Workflow management" contains 22 icons.
Use it to design your business process workflow diagrams with ConceptDraw PRO software.
"Management in businesses and organizations is the function that coordinates the efforts of people to accomplish goals and objectives by using available resources efficiently and effectively.
Management includes planning, organizing, staffing, leading or directing, and controlling an organization to accomplish the goal or target. Resourcing encompasses the deployment and manipulation of human resources, financial resources, technological resources, and natural resources." [Management. Wikipedia]
The icons example "Design elements - Workflow management" is included in the Business Process Workflow Diagrams solution from the Business Processes area of ConceptDraw Solution Park.
Management icons
How to Draw an Effective Workflow

Affinity Diagram

Drawing Workflow Diagrams
- Natural Resource Topic And Diagram
- Affinity Diagram | Affinity Diagram | Process Diagrams | Natural ...
- Natural Resource And Development Flow Chart
- UK Map | UK Map | Bar Diagram Math | 3 Examples Of Natural ...
- Sustainability And Development Of Natural Resources
- Diagram For Types Of Natural Resources
- Prepare A Flowchart Of Various Natural Resources
- Business Process Solutions For Natural Resources
- Natural Resources Eazy Drawing
- Circular Arrows Diagrams | Pie Chart Of Conservation Of Resources
- Management Of Natural Resources Flow Chart
- Process Diagrams | Affinity Diagram | Draw Flowcharts with ...
- How To Draw Natural Resources
- Sustainable Use Of Resources Diagrams
- Digram Of Natural Resources
- Natural Resources Diagrams
- Pie Chart On Types Of Natural Resources
- Diagrams To Draw On Natural Resources
- Natural Resources Diagram