This site uses cookies. By continuing to browse the ConceptDraw site you are agreeing to our Use of Site Cookies.
HelpDesk

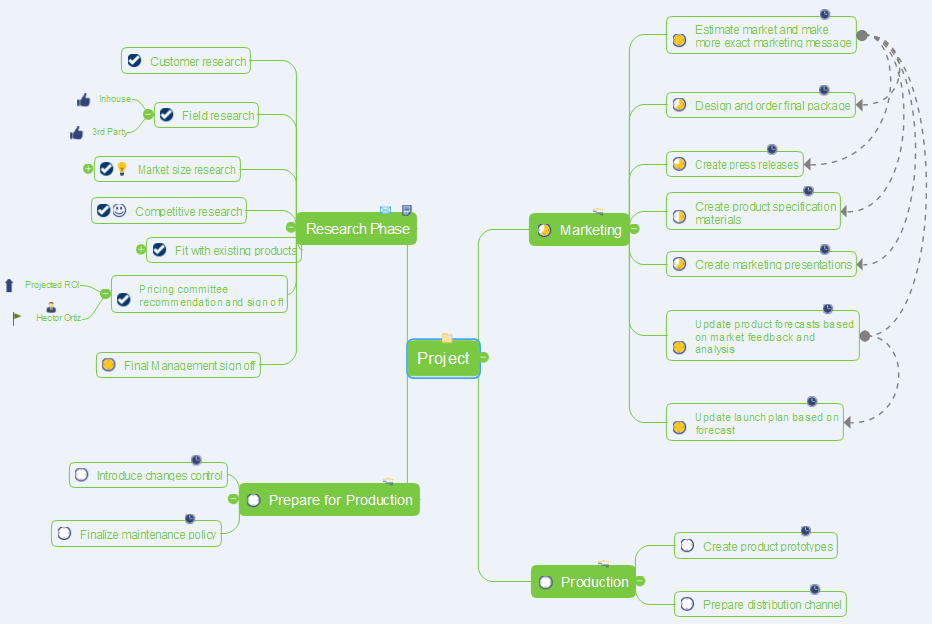
How to Show the Relationship Between Topics

Any mind map contains topics that are arranged in a radial structure. It depicts the relation (semantic, causal, association, etc.) between the concepts, parts, and components of the main idea. In addition to the main connections that make the structure of a mind map, topics can be linked with other lines. ConceptDraw MINDMAP allows you to show the relationships between topics, which belong to different parts of the mind map structure, but also influence each other. Relationships help to show and organize complex interconnections between topics of mind map visually. Such communication is also very important - the mind map, where many topics are not related, tends to turn into a common text.
HelpDesk

How to Make a Mind Map from a Project Gantt Chart

ConceptDraw Office allows you to see the project data from ConceptDraw PROJECT in a mind map structure by opening your project in ConceptDraw MINDMAP.
HelpDesk

How to Make a Project Tasks Mind Map from Brainstorm

Start a project with creating a mind map, structuring ideas captured during a brainstorming session. The easiest way to start a new project is to conduct a brainstorming session that identifies the necessary tasks and then to develop it into a project schedule.

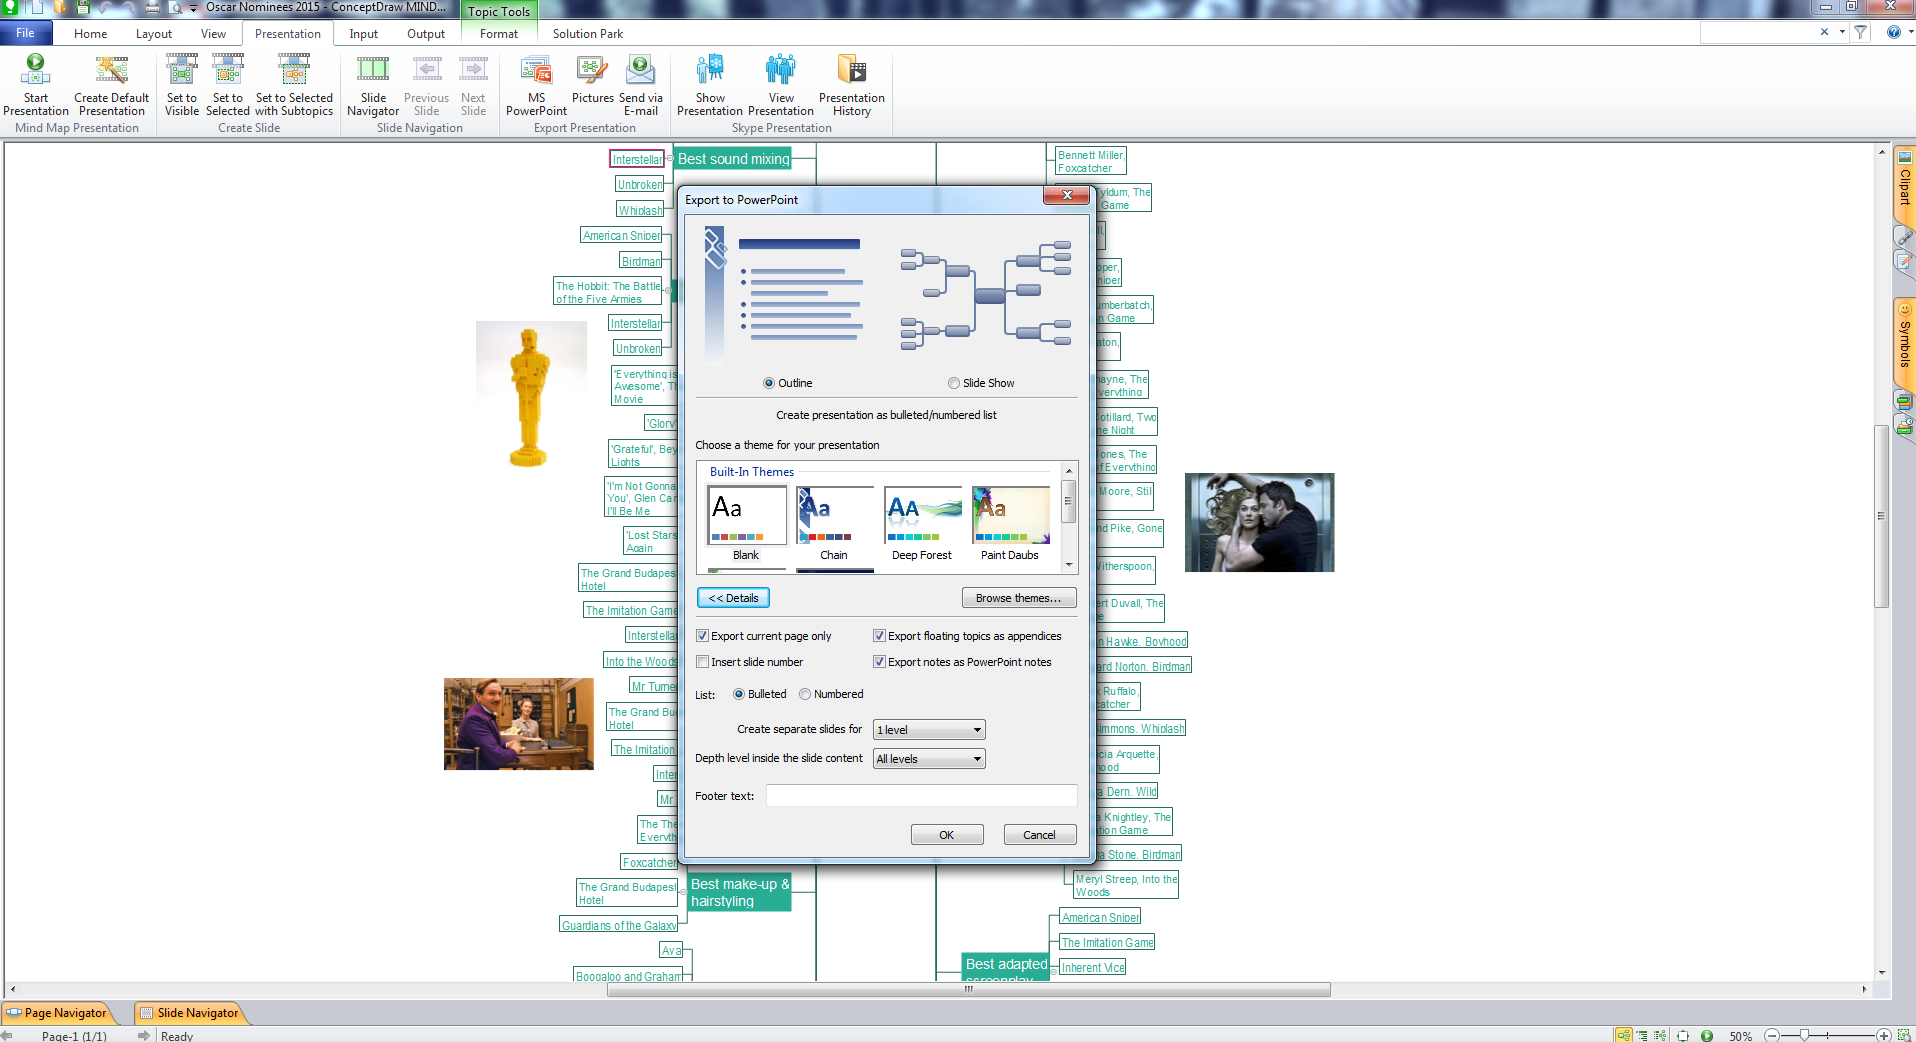
Presentation in MINDMAP All in One

When planning to create a neat presentation out of lot of data, try mind mapping.
It is handy, especially when you want to represent pictures and text on the same page.
With the Presentation Exchange solution you can easily extract the content from a PowerPoint presentation to see how it all fits together in a single view. You can review slide content, see how the slides support one another, and refine the story.
How to Succeed in Business

Product Overview

The role of ConceptDraw MINDMAP is to organize and plan idea development and communicate between process participants. Mind maps are convenient to prepare presentations for team and management and send task lists and related information.

Entity Relationship Diagram Examples

Creating an entity-relationship (ER) model is to visually represent the structure of a business database, where data equates to entities (or objects) that are linked by defined relationships expressing dependencies and requirements. By nature it is an abstract visualization, the first step in the design process towards creating a logical and functional database.
ConceptDraw gives the ability to describe a database using the Entity-Relationship model. Entity-Relationship Diagram solution includes icons advocated by Chen's and Crow’s Foot notation that can be used when describing a database.
How to Build an Entity Relationship Diagram (ERD)
HelpDesk

Agile Mind Maps: Exploring the User Wishes

Agile method advocate use cases and user stories, but there are no standard processes or guides available to help gather user requirements. That is why documenting user requirements can be challenging. Without strong communication experience, the Scrum process can collapse, leading towards unfruitful requirements and imperfect software. This article offers a path to overcome these hurdles through the simplicity and clearness of mind mapping. ConceptDraw Scrum Workflow solution lets explore the user requirements for your Agile development project before they are formalized. You can easily create professional Mind Maps that will effectively collect and structure the information on what a user actually wants, or the User Wish.

Data Modeling with Entity Relationship Diagram

Data modeling is actively applied in analysis and uses wide set of methods for description the data requirements in a system. One of the most popular and well-known is the ERD method of database modeling.
The best ERD tool for the Mac and Windows is ConceptDraw DIAGRAM software extended with the Entity-Relationship Diagram (ERD) solution from the Software Development Area for ConceptDraw Solution Park, which is sharpened for professional ERD drawing and data modeling with Entity Relationship Diagram.

Relationships Analysis

Relationships Analysis. Relations Diagram - factors analysis, factors relations. Create Relations Diagram with ConceptDraw DIAGRAM.
The Seven Management and Planning Tools is a tool for Interaction diagram drawing. This diagram identifies causal relationships. Determine what factors are causes and which factors are effects. Interaction diagram helps establish KPIs to monitor changes and the effectiveness of corrective actions in resolving the problem.

Entity Relationship Diagram Symbols

Creating an entity-relationship (ER) model is to visually represent the structure of a business database, where data equates to entities (or objects) that are linked by defined relationships expressing dependencies and requirements. By nature it is an abstract visualization, the first step in the design process towards creating a logical and functional database.
ERD symbols used for professional ERD drawing are collected in libraries from the Entity-Relationship Diagram (ERD) solution for ConceptDraw DIAGRAM.