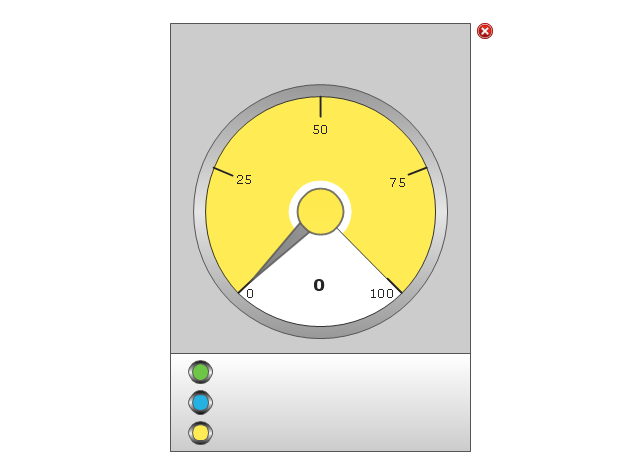
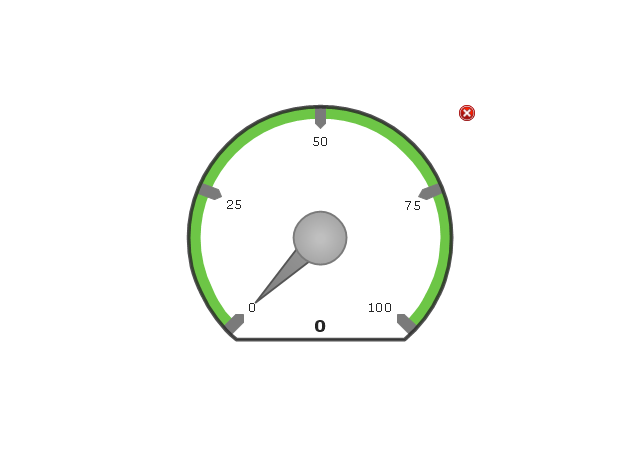
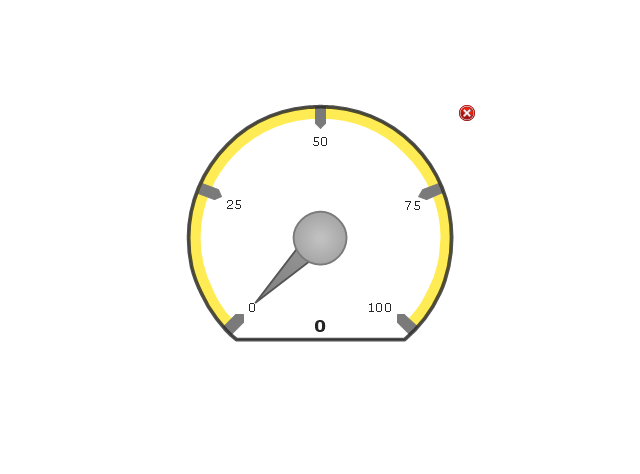
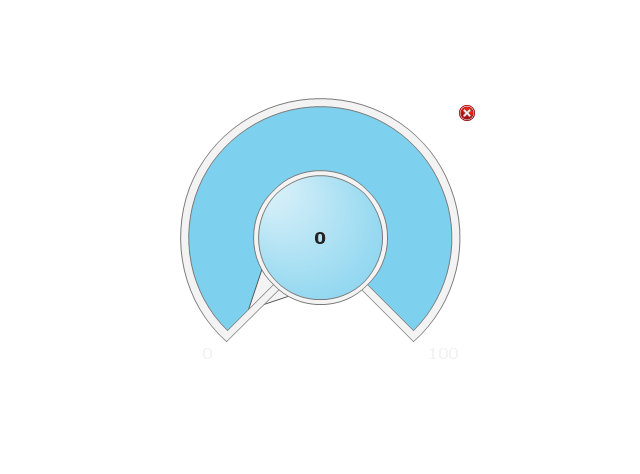
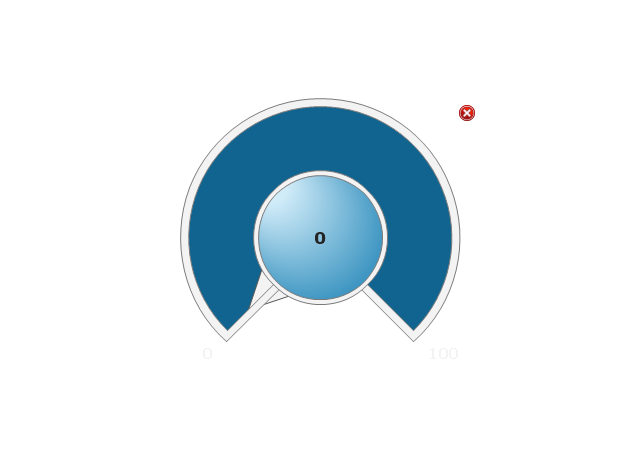
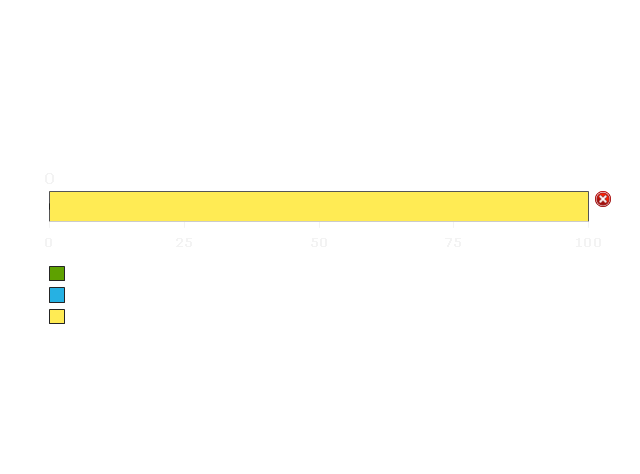
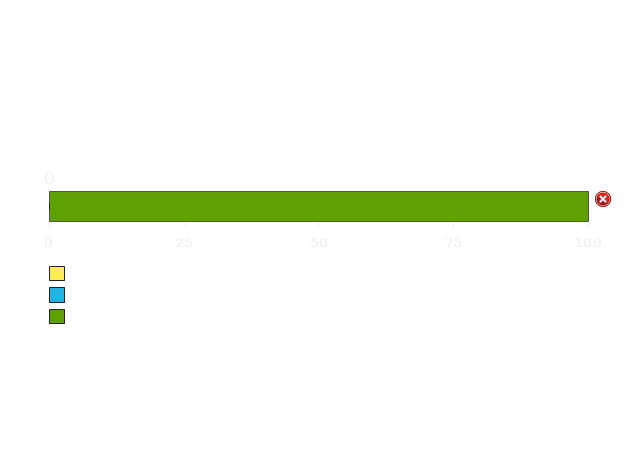
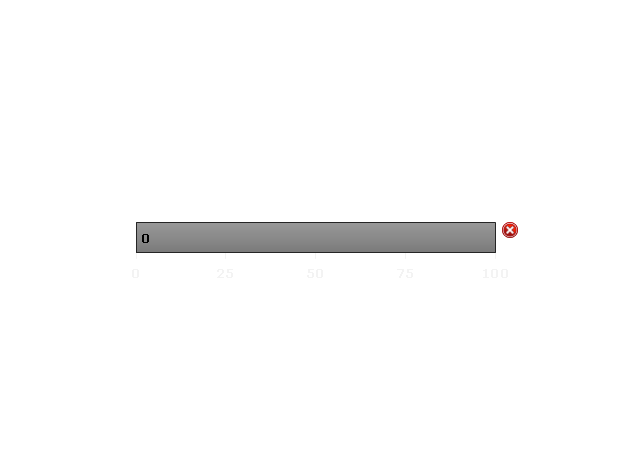
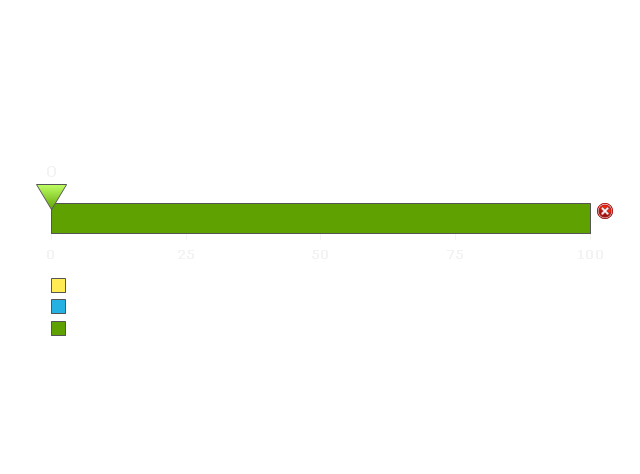
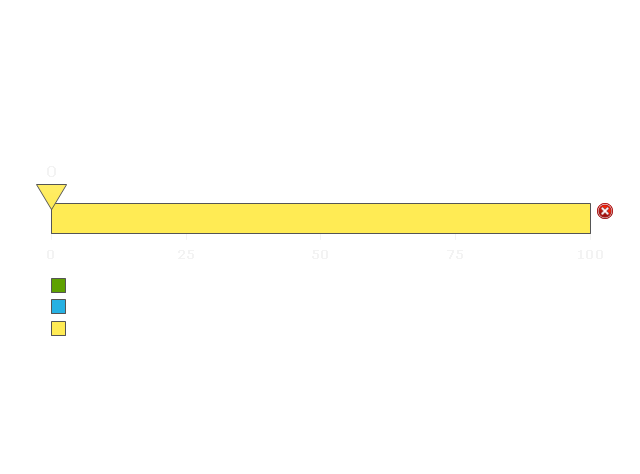
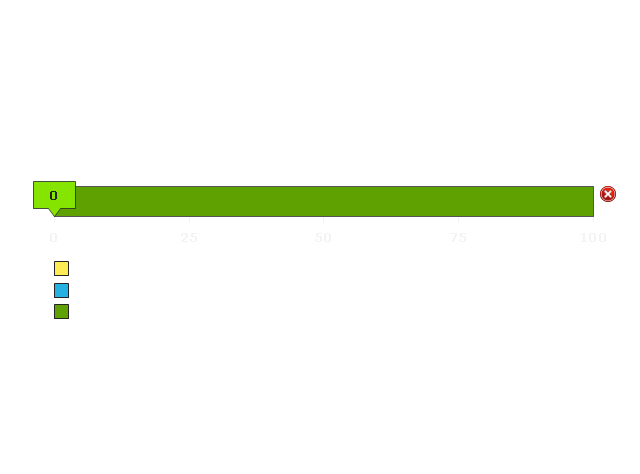
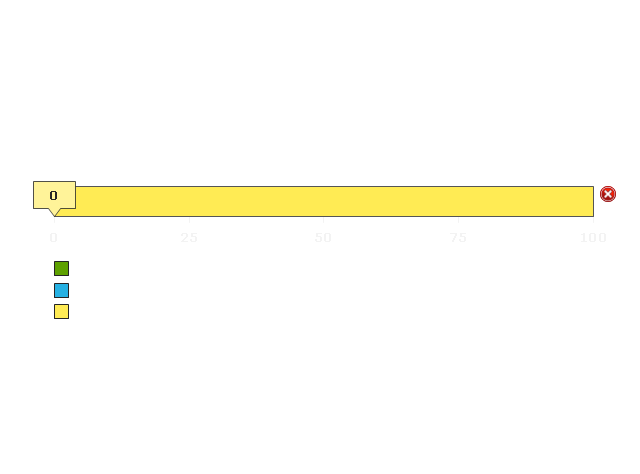
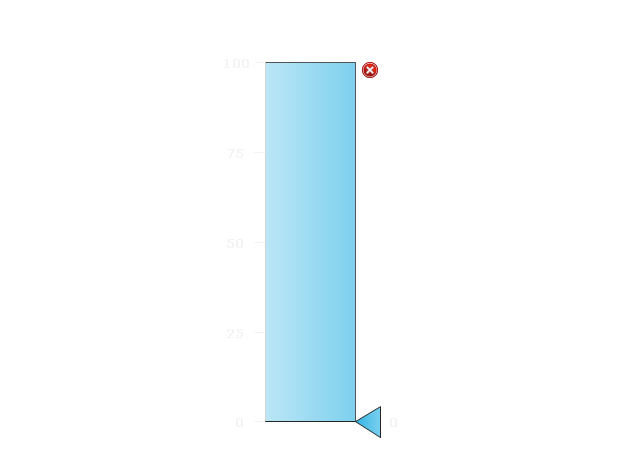
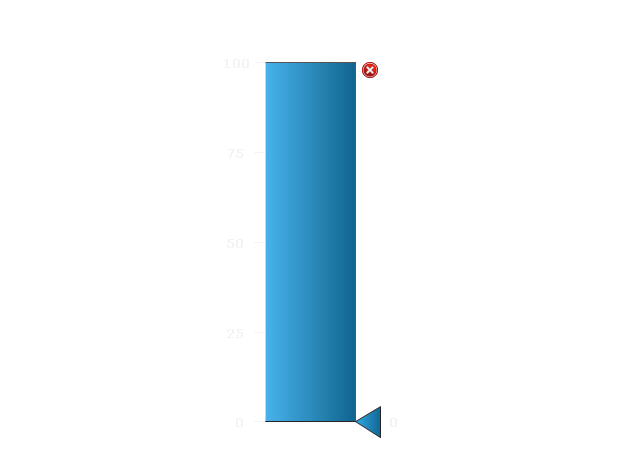
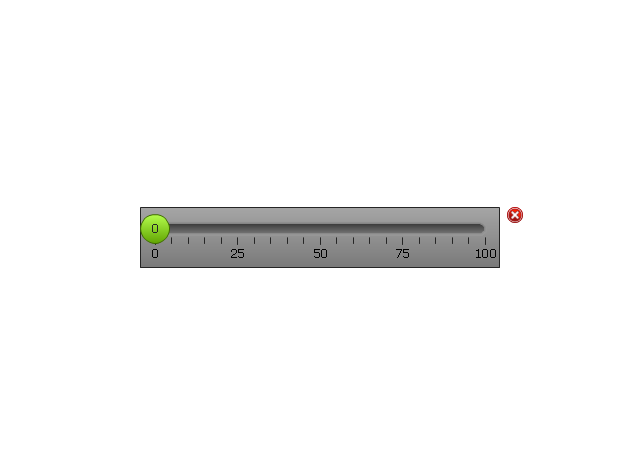
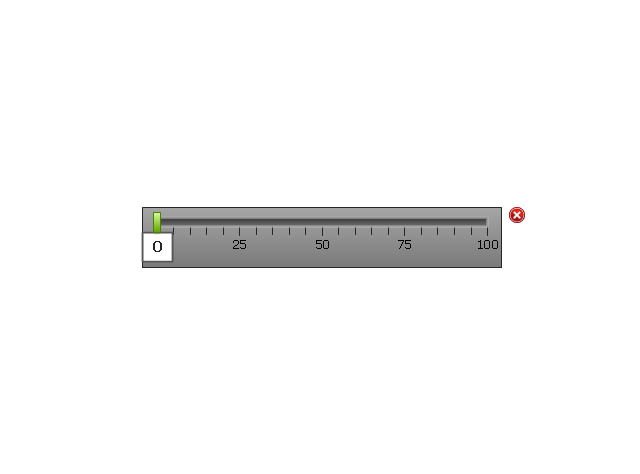
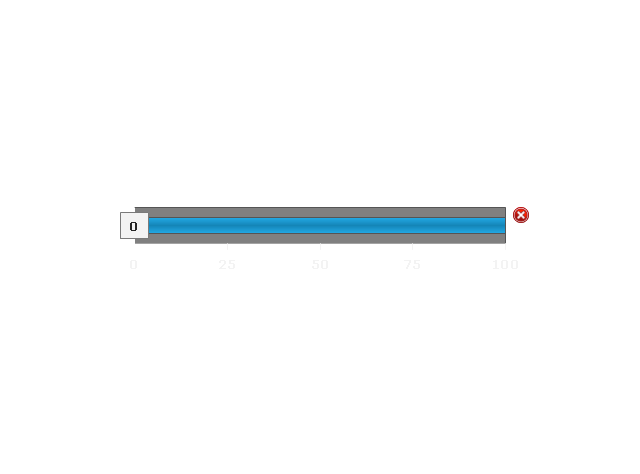
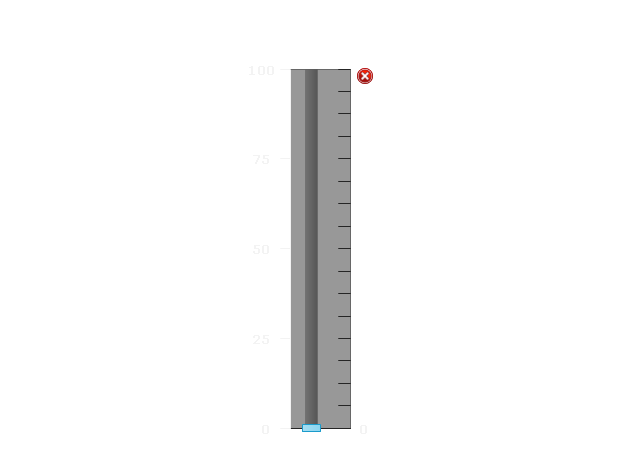
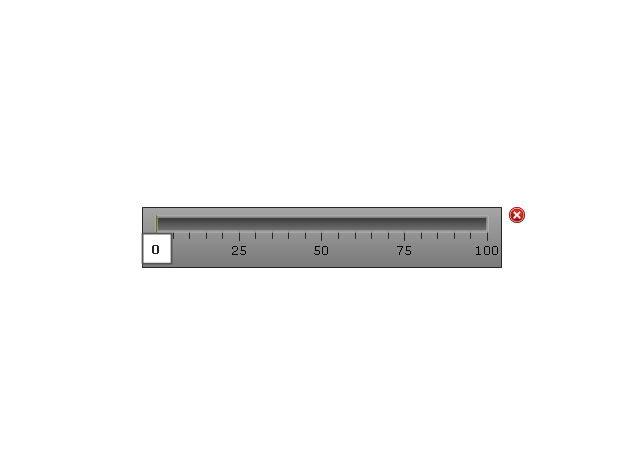
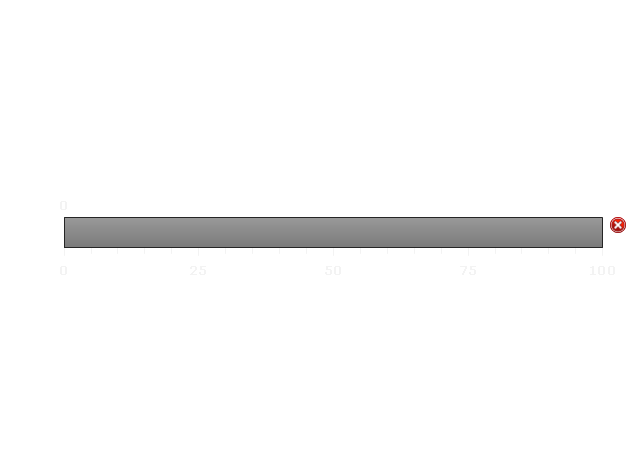
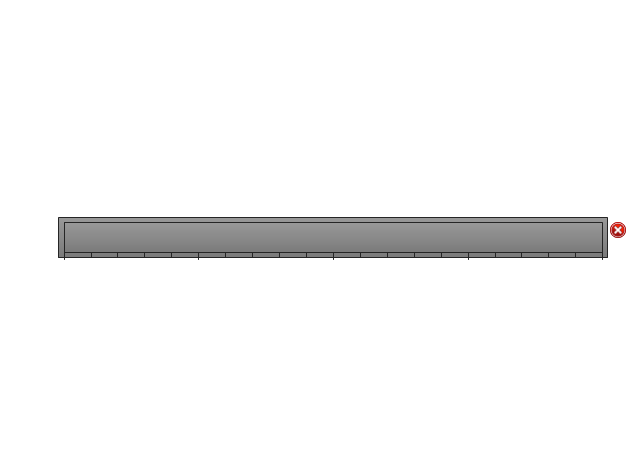
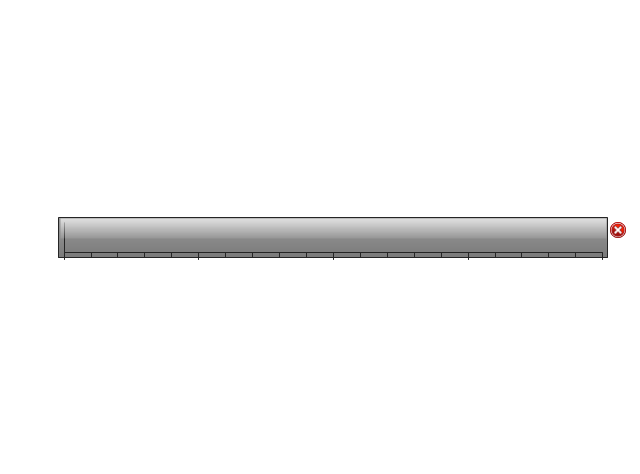
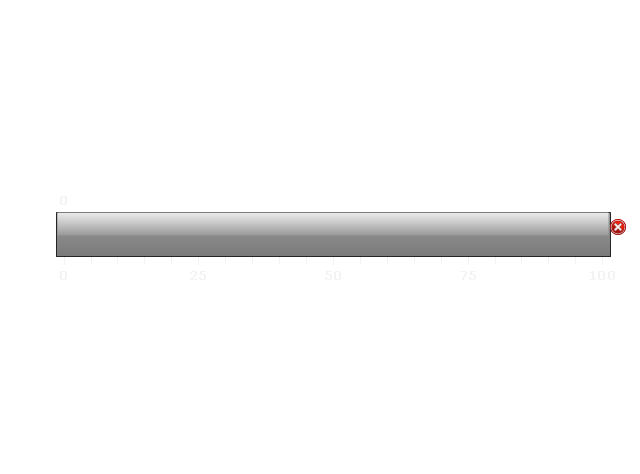
The vector stencils library "Meter indicators" contains 29 Live Objects: speedometer gauge, dial, bullet graph, slider and level meter visual indicators.
The Live Objects designed to display actual measures of performance metrics and KPIs from external data source files.
Some of them also display comparative measures, and colored zones of qualitative ranges with legend.
Use it to draw business performance dashboards using the ConceptDraw PRO diagramming and vector drawing software .
"Digital dashboards may be laid out to track the flows inherent in the business processes that they monitor. Graphically, users may see the high-level processes and then drill down into low level data. This level of detail is often buried deep within the corporate enterprise and otherwise unavailable to the senior executives. ...
Specialized dashboards may track all corporate functions. Examples include human resources, recruiting, sales, operations, security, information technology, project management, customer relationship management and many more departmental dashboards. ...
Like a car's dashboard (or control panel), a software dashboard provides decision makers with the input necessary to "drive" the business. Thus, a graphical user interface may be designed to display summaries, graphics (e.g., bar charts, pie charts, bullet graphs, "sparklines," etc.), and gauges (with colors similar to traffic lights) in a portal-like framework to highlight important information. ...
Digital dashboards allow managers to monitor the contribution of the various departments in their organization. To gauge exactly how well an organization is performing overall, digital dashboards allow you to capture and report specific data points from each department within the organization, thus providing a "snapshot" of performance." [Dashboard (management information systems). Wikipedia]
The example "Design elements - Meter indicators" is included in the Meter Dashboard solution from the area "What is a Dashboard" of ConceptDraw Solution Park.
Visual indicators

 Meter Dashboard
Meter dashboard solution extends ConceptDraw DIAGRAM software with templates, samples and vector stencils library with meter indicators for drawing visual dashboards showing quantitative data. The Meter Dashboard solution may be useful for many business owners, businessmen and other people who are involved in measuring their success by using the progressive tools.
Electrical Symbols — Lamps, Acoustics, Readouts

Soccer (Football) Dimensions
 Dimensions *")
The vector stencils library "Meter indicators 2" (for dark background) contains 29 Live Objects: speedometer gauge, dial, bullet, slider and level meter visual indicators.
The Live Objects designed to display actual measures of performance metrics from external data source files. Some of them also display comparative measures, and colored zones of qualitative ranges with legend.
Use this library to create visual dashboards in the ConceptDraw PRO diagramming and vector drawing software extended with the Meter Dashboard solution from the area "What is a Dashboard" of ConceptDraw Solution Park.
Speedometer Gauge 1

Speedometer Gauge 2
Speedometer Gauge 3
Speedometer Gauge 4
Dial 1
Dial 2
Bullet 1

Bullet 2
Bullet 3
Bullet 4

Bullet 5

Bullet 6

Directed Bullet 1
Directed Bullet 2

Slider Horizontal 1
Slider Horizontal 2
Slider Horizontal 3
Slider Horizontal 4
Slider Vertical 1
Slider Vertical 2
Slider Horizontal 5
Slider Horizontal 6
Slider Horizontal 7
Slider Vertical 3
Level Meter 1
Level Meter 2
Level Meter 3
Level Meter 4
Level Meter 5
This example was created on the base of the Georgia DOT Performance Management Dashboard from the Georgia Department of Transportation website.
[dot.ga.gov/ informationcenter/ statistics/ performance/ Pages/ default.aspx]
"Performance management (PM) includes activities which ensure that goals are consistently being met in an effective and efficient manner. Performance management can focus on the performance of an organization, a department, employee, or even the processes to build a product of service, as well as many other areas.
PM is also known as a process by which organizations align their resources, systems and employees to strategic objectives and priorities.
Performance management originated as a broad term coined by Dr. Aubrey Daniels in the late 1970s to describe a technology (i.e. science imbedded in applications methods) for managing both behavior and results, two critical elements of what is known as performance. A formal definition of performance management, according to Daniels' is "a scientifically based, data-oriented management system. It consists of three primary elements-measurement, feedback and positive reinforcement."" [Performance management. Wikipedia]
The meter dashboard example "Georgia DOT Performance Management" was created using the ConceptDraw PRO diagramming and vector drawing software extended with the Meter Dashboard solution from the area "What is a Dashboard" of ConceptDraw Solution Park.
Meter dashboard

Building Drawing Software for Designing Plumbing


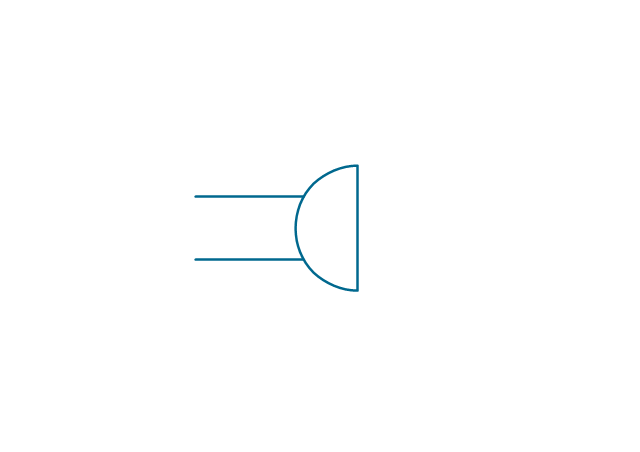
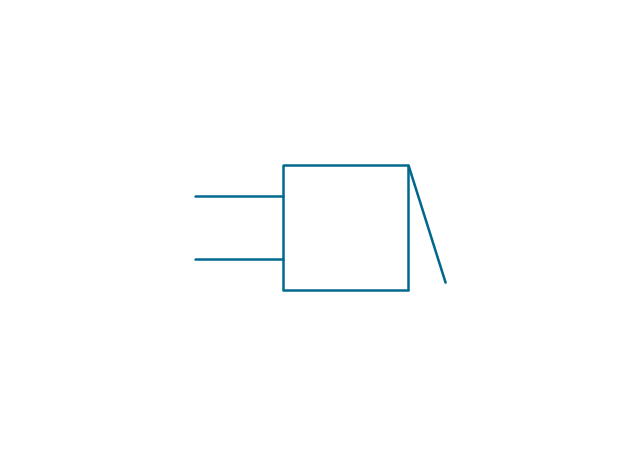
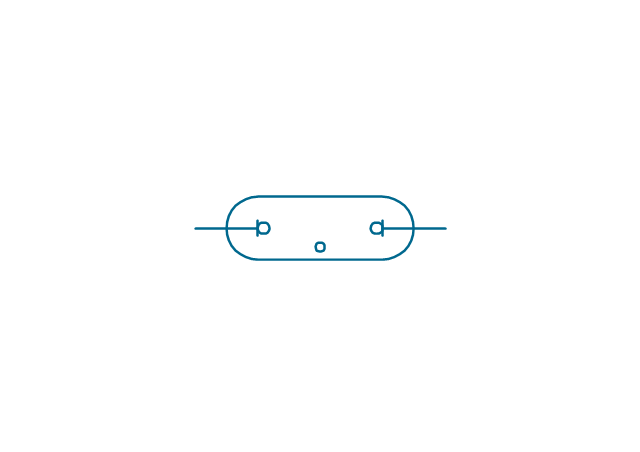
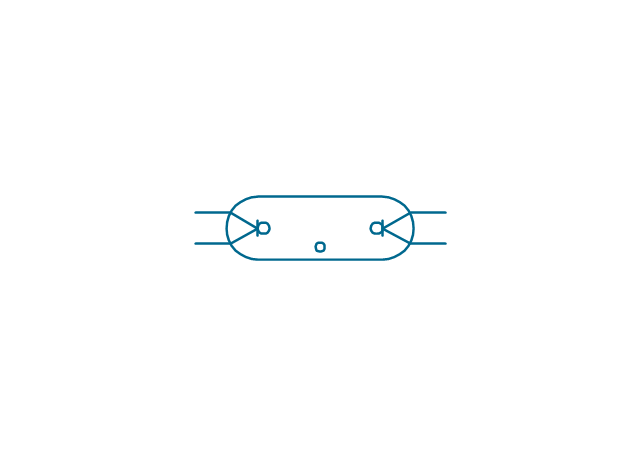
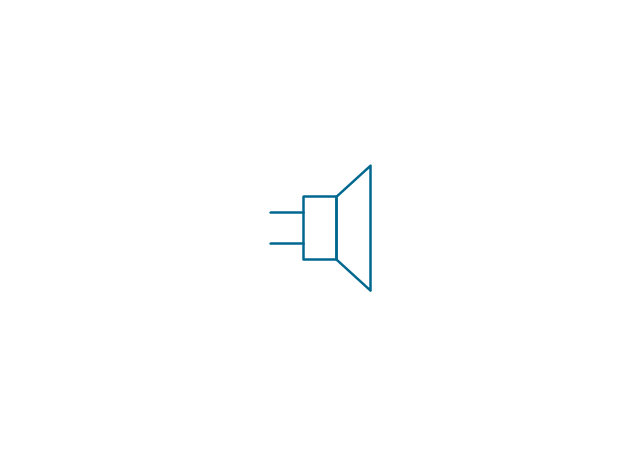
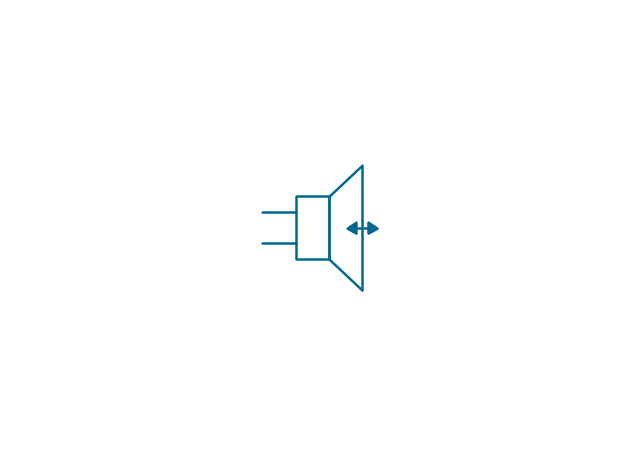
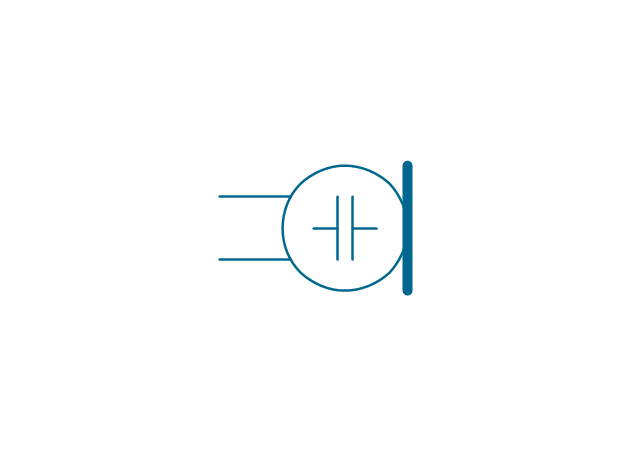
The vector stencils library "Lamps, acoustics, measuring instruments" contains 35 element symbols of lamps, acoustic components, electrical measuring instruments.
Use these shapes for drawing electrical schematics and electronic circuit diagrams in the ConceptDraw PRO diagramming and vector drawing software extended with the Electrical Engineering solution from the Engineering area of ConceptDraw Solution Park.
www.conceptdraw.com/ solution-park/ engineering-electrical
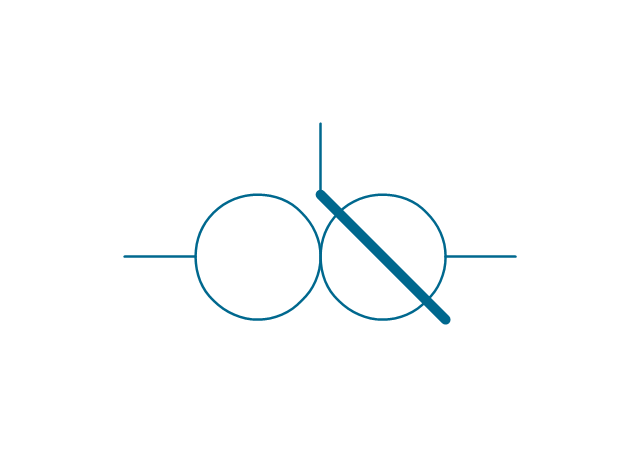
Ammeter

Frequency meter

Voltmeter

Galvanometer

Oscilloscope

Synchroscope

Thermometer

Wavemeter

Standard bell with 1 line input
Single-stroke bell with 1 line input
Siren with 1 line input
Standard bell with 2 lines input
Bell with 2 lines input
Bell with 1 line input
Single-stroke bell with 2 lines input
Siren with 2 lines input
Buzzer with 1 line input
Buzzer with 2 lines input
Buzzer with 2 lines input
Buzzer with 1 line input
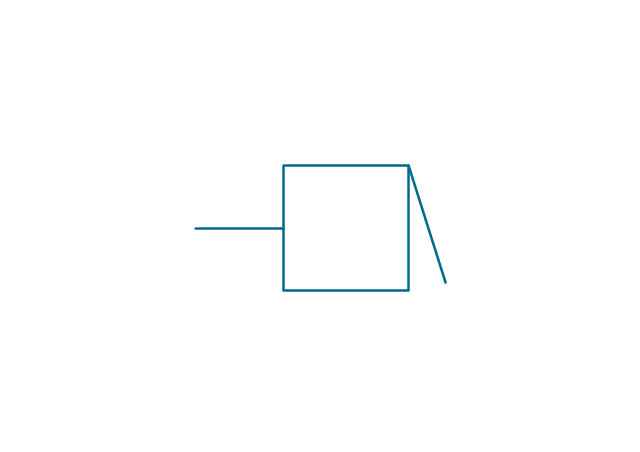
Indicating lamp with 1 line input

Non-indicating lamp with 1 line input

Indicating lamp with 2 lines input

Non-indicating lamp with 2 lines input

Signal lamp

Lamp

Fluorescent lamp 2 terminal
Fluorescent lamp 4 terminal
Speaker
Speaker with microphone
Microphone

Capacitor microphone
Push-pull microphone
Microphone with 1 line
Microphone with 2 lines

CAD Drawing Software for Making Mechanic Diagram and Electrical Diagram Architectural Designs


Building Drawing Software for Design Piping Plan

 One-line Diagrams
One-line Diagrams solution is a powerful electrical engineering tool to develop precise and detailed One-line Diagram, Single-line Diagram, Electrical diagram. This solution supplies the ConceptDraw DIAGRAM users with a wide set of vector libraries with special icons and electrical symbol elements for one-line drawing and electrical engineering diagram design including. It includes a large collection of samples of One-line Diagrams illustrating high-voltage and low-voltage systems, different electrical configurations and topologies, transmission systems, application of circuit breakers, protection electrical equipment, etc. It is perfect for all power-related workers, engineers, electricians, and other professionals working in power engineering and energy industries.
Mechanical Drawing Symbols F.A.Q. How to Use Mechanical Engineering Design Software

Electrical Symbols — VHF UHF SHF

Building Drawing Software for Design Seating Plan

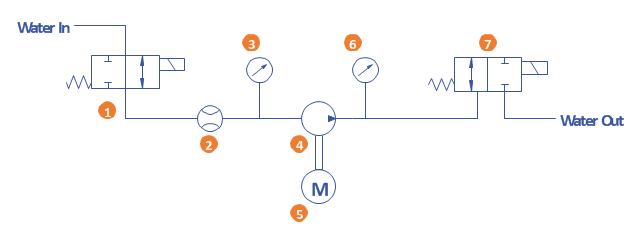
A simple hydraulic schematic showing apparatus for testing the strength of a hydraulic hose splice.
Water enters through normally closed solenoid valve (1) and passes through intake flow meter (2) to high pressure pump (4). Intake water pressure is monitored by pressure gauge (3). The hose to be tested connects between pump (4) and normally open solenoid activated drain valve (7). To test the hose, pump drive motor (5) is turned on, the solenoid of drain valve (7) is activated, closing the valve, and the pump is run to pressurize the hose. Test pressure is monitored by gauge (6). When the test is complete or the hose fails, the solenoid of drain valve (7) is deactivated, opening valve and discharging water, depressurizing the system. All components are operated electrically by a remote control circuit so that the operator may perform the test from a protected location, monitoring it with a camera and video monitor.
This hydraulic schematic example was redrawn using ConceptDraw PRO diagramming and vector drawing software from the Wikimedia Commons file: Hydraulic schematic.jpg.
[commons.wikimedia.org/ wiki/ File:Hydraulic_ schematic.jpg]
This file is licensed under the Creative Commons Attribution-Share Alike 3.0 Unported license.
[creativecommons.org/ licenses/ by-sa/ 3.0/ deed.en]
The hydraulic schematic example "Apparatus for testing the strength of a hydraulic hose splice" is included in the Mechanical Engineering solution from the Engineering area of ConceptDraw Solution Park.
Hydraulic system schematic
 Entity-Relationship Diagram (ERD)
Entity-Relationship Diagram (ERD) solution extends ConceptDraw DIAGRAM charting and vector drawing software with the ability to describe a database using the Entity-Relationship model. This solution includes icons advocated by Chen’s and Crow’s Foot notation that can be used when describing a database. The vector graphic diagrams produced when using this solution can be employed in your white papers, presentations, data sheets, posters, or any technical material.
Electrical Drawing Software and Electrical Symbols

Kitchen Planning Software

Mechanical Design Software

Balanced Scorecard Software

- Design elements - Meter indicators | Software Engineer Package ...
- Balanced Scorecard Software | Design elements - Meter indicators ...
- Meter Dashboard | Design elements - Meter indicators | Design ...
- Aerospace and Transport | Design elements - Meter indicators | Car ...
- Design elements - Meter indicators | Business Graphics Software
- Design elements - Meter indicators 2 | Gauge Meter Design
- ConceptDraw Solution Park | Meter Dashboard | Network Drawing ...
- Software development with ConceptDraw DIAGRAM | Meter ...
- Design elements - Android switches and sliders | Meter indicators 2 ...
- Design elements - Meter indicators | Dashboard Dials Design