Flow chart Example. Warehouse Flowchart


Material Requisition Flowchart. Flowchart Examples

Process Flowchart


Value stream with ConceptDraw PRO

Types of Flowcharts


Flowchart Marketing Process. Flowchart Examples

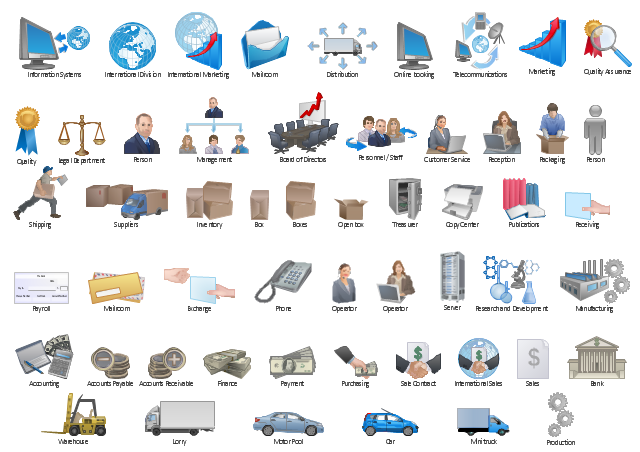
The vector stencils library "Workflow diagrams" contains 54 symbol icons for drawing the work flow charts.
Use these clipart to represent information flow, automation of business processes, business process re-engineering, accounting, management, and human resources tasks in industry, business, and manufacturing.
"A workflow consists of an orchestrated and repeatable pattern of business activity enabled by the systematic organization of resources into processes that transform materials, provide services, or process information. It can be depicted as a sequence of operations, declared as work of a person or group, an organization of staff, or one or more simple or complex mechanisms.
From a more abstract or higher-level perspective, workflow may be a view or representation of real work, thus serving as a virtual representation of actual work. The flow being described may refer to a document, service or product that is being transferred from one step to another.
Workflows may be viewed as one fundamental building block to be combined with other parts of an organisation's structure such as information silos, teams, projects, policies and hierarchies." [Workflow. Wikipedia]
The clipart example "Design elements - Workflow diagram" was drawn using the ConceptDraw PRO diagramming and vector drawing software extended with the Workflow Diagrams solution from the Business Processes area of ConceptDraw Solution Park.
Workflow symbols
Cross Functional Flowchart Examples

Value-Stream Mapping for Manufacturing
")
Value Stream Mapping for the Lean Office
")
Value Stream Mapping Symbols

Bar Diagrams for Problem Solving. Create manufacturing and economics bar charts with Bar Graphs Solution

Value Stream & Process Flow Diagramming Software

Value Stream Mapping Tool
 diagram vector stencils")
- Draw A Flow Diagram Of Material Management
- Process Flowchart | Material Requisition Flowchart. Flowchart ...
- Material Management Data Flow Diagram
- Process Flowchart | Material Requisition Flowchart. Flowchart ...
- Flow chart Example. Warehouse Flowchart | Material Requisition ...
- Flow Chart For Working Of Manufacturing Organization
- Flow Chart For Material Management System
- Manufacturing Business Flow Chart
- Material Requisition Flowchart. Flowchart Examples | Flow chart ...
- Role Of Material Management Flow Chart
- Manufacturing Process Flow Chart
- Process Flowchart | Data Flow Diagram Model | Manufacturing 8 Ms ...
- Material Requisition Flowchart. Flowchart Examples | Flow chart ...
- Process Flowchart | Flow chart Example. Warehouse Flowchart ...
- Draw The Flow Chart Of Production Of Material
- Process Flowchart | Flow chart Example. Warehouse Flowchart ...
- Production Process Flow Sample
- Material Requisition Flowchart. Flowchart Examples | Workflow ...
- Process Flowchart | Flow chart Example. Warehouse Flowchart ...
- Process Flow Chart Of Production Planning