Context Diagram Template
This template shows the Context Diagram. It was created in ConceptDraw DIAGRAM diagramming and vector drawing software using the Block Diagrams Solution from the “Diagrams” area of ConceptDraw Solution Park.
The context diagram graphically identifies the system. external factors, and relations between them. It’s a high level view of the system. The context diagrams are widely used in software engineering and systems engineering for designing the systems that process the information.
Process Flowchart
ConceptDraw is Professional business process mapping software for making process flow diagram, workflow diagram, general flowcharts and technical illustrations for business documents. It is includes rich examples, templates, process flowchart symbols. ConceptDraw flowchart maker allows you to easier create a process flowchart. Use a variety of drawing tools, smart connectors, flowchart symbols and shape libraries to create flowcharts of complex processes, process flow diagrams, procedures and information exchange.Pyramid Diagram
A three level pyramid model of different types of Information Systems based on the type of decisions taken at different levels in the organization.Types of Flowcharts
A Flowchart is a graphically representation of the process, algorithm or the step-by-step solution of the problem. There are ten types of Flowcharts. Using the Flowcharts solution from the Diagrams area of ConceptDraw Solution Park you can easy and quickly design the Flowchart of any of these types.Data Flow Diagram
Data flow diagram (DFD) is the part of the SSADM method (Structured Systems Analysis and Design Methodology), intended for analysis and information systems projection. Data flow diagrams are intended for graphical representation of data flows in the information system and for analysis of data processing during the structural projection. Data flow diagram often used in connection with human process and can be displayed as workflow diagram. The critical Process Flow Diagram is another flowchart technique for designing data flow in connection with organizational processes. The critical Process flow diagram may use different range of symbols than a classic workflow diagram.Basic Flowchart Symbols and Meaning
Flowchart Symbols and Meaning - Provides a visual representation of basic flowchart symbols and their proposed use in professional workflow diagram, standard process flow diagram and communicating the structure of a well-developed web site, as well as their correlation in developing on-line instructional projects. See flowchart's symbols by specifics of process flow diagram symbols and workflow diagram symbols.Data Flow Diagram Examples
You need to draw the Data Flow Diagram? Use ConceptDraw DIAGRAM diagramming and vector drawing software extended with Data Flow Diagrams solution from the Software Development area of ConceptDraw Solution Park.The Data Flow Diagrams solution provides a numerous collection of Data Flow Diagram examples created according to Gane and Sarson, and Yourdon and Coad notations using the ConceptDraw DIAGRAM software.
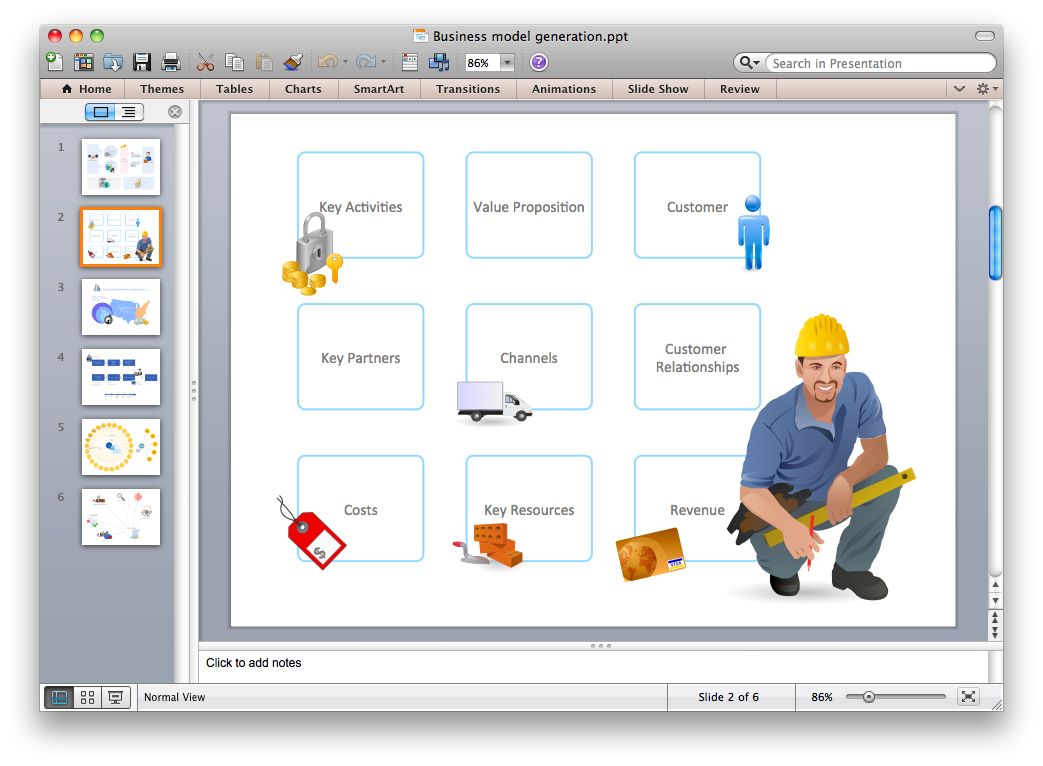
Export from ConceptDraw DIAGRAM Document to PPT or PPTX (MS PowerPoint®) File
ConceptDraw DIAGRAM has extensive export capabilities which allow you to export your drawing to MS PowerPoint file formats. So, you can create effective presentations right from your ConceptDraw DIAGRAM documents.How Do Fishbone Diagrams Solve Manufacturing Problems
How do Fishbone diagrams solve manufacturing problems? Fishbone diagrams are successfully used in various fields of industries and manufacturing to analyze the set of possible causes and their effects. Fishbone diagram provides a process to clearly define the “Effect” and then puts you to thinking about the possible causes, based on the categories of common problems in manufacturing.ConceptDraw DIAGRAM application extended with Fishbone Diagrams solution lets you construct Fishbone diagrams and represent globally recognized standards for manufacturing 6 Ms and 8 Ms.
Data Flow Diagram (DFD)
This example is created using ConceptDraw DIAGRAM enhanced with solution Data Flow Diagrams. This diagram shows one of the business processes to simplify and accelerate understanding, analysis, and representation.- Manufacturing Information System Ppt
- Manufacturing Information System Dfd
- Data Flow Diagram Model | How Do Fishbone Diagrams Solve ...
- How Do Fishbone Diagrams Solve Manufacturing Problems ...
- Manufacturing and Maintenance | Presentation Clipart | Holiday ...
- Manufacturing Accounting Flowchart
- Auto Mobile Information System Flowchart
- Data Floor Diagram For Library Management System
- Car Manufacturing Process Diagram
- Flowchart Of The Sales Department Manufacturing Company
- ERD | Entity Relationship Diagrams, ERD Software for Mac and Win
- Flowchart | Basic Flowchart Symbols and Meaning
- Flowchart | Flowchart Design - Symbols, Shapes, Stencils and Icons
- Flowchart | Flow Chart Symbols
- Electrical | Electrical Drawing - Wiring and Circuits Schematics
- Flowchart | Common Flowchart Symbols