The vector stencils library "Circular diagrams" contains 42 templates of circular diagrams: circular arrow diagram, circular motion diagram, arrow ring chart, doughnut chart (donut chart), circle pie chart, diamond pie chart, circle diagram, pie chart, ring chart, loop diagram, block loop diagram, arrow loop circle, crystal diagram, triangular diagram, diamond diagram, pentagon diagram, hexagon diagram, heptagon diagram, cycle diagram (cycle chart), stacked Venn diagram (onion diagram), arrow circle diagram.
Use these shapes to illustrate your marketing and sales documents, presentations, webpages and infographics in the ConceptDraw PRO diagramming and vector drawing software extended with the Target and Circular Diagrams solution from the Marketing area of ConceptDraw Solution Park.
www.conceptdraw.com/ solution-park/ marketing-target-and-circular-diagrams
Circular arrow diagram 1
Circular arrow diagram 2
Arrow ring chart
Doughnut chart

Diamond pie chart

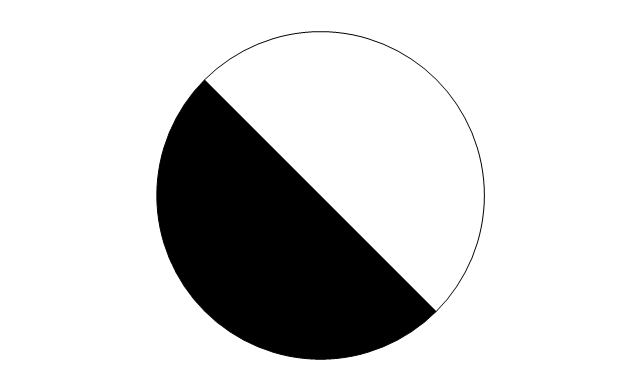
Pie chart

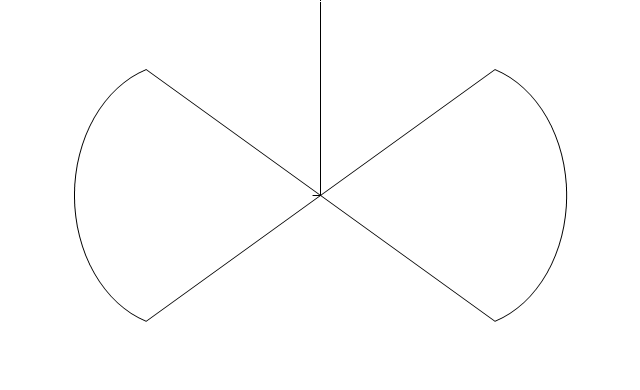
Circle diagram

Circle pie chart 2

Circle pie chart 1

Ring chart 1 - 3 elements

Ring chart 1 - 4 elements

Ring chart 1 - 5 elements

Ring chart 1 - 6 elements

Ring chart 1 - 7 elements

Ring chart 2 - 3 elements

Ring chart 2 - 4 elements

Ring chart 2 - 5 elements

Ring chart 2 - 6 elements

Ring chart 2 - 7 elements

Crystal diagram - 3 elements

Crystal diagram - 4 elements

Crystal diagram - 5 elements

Crystal diagram - 6 elements

Crystal diagram - 7 elements

Stacked Venn diagram - 4

Stacked Venn diagram - 5

Stacked Venn diagram - 6

Stacked Venn diagram - 7

Basic loop diagram

Block loop diagram

Arrow loop circle
Arrow loop - 3 circles
Arrow loop - 4 circles
Arrow loop - 5 circles
Arrow loop - 6 circles
Arrow loop - 7 circles
Arrow circle diagram - 3
Arrow circle diagram - 4
Stacked Venn diagram - 3

Arrow circle diagram - 5
Arrow circle diagram - 6
Arrow circle diagram - 7
The vector stencils library "Circular diagrams" contains 42 templates of circular diagrams: circular arrow diagram, circular motion diagram, arrow ring chart, doughnut chart (donut chart), circle pie chart, diamond pie chart, circle diagram, pie chart, ring chart, loop diagram, block loop diagram, arrow loop circle, crystal diagram, triangular diagram, diamond diagram, pentagon diagram, hexagon diagram, heptagon diagram, cycle diagram (cycle chart), stacked Venn diagram (onion diagram), arrow circle diagram.
Use these shapes to illustrate your marketing and sales documents, presentations, webpages and infographics in the ConceptDraw PRO diagramming and vector drawing software extended with the Target and Circular Diagrams solution from the Marketing area of ConceptDraw Solution Park.
www.conceptdraw.com/ solution-park/ marketing-target-and-circular-diagrams
Use these shapes to illustrate your marketing and sales documents, presentations, webpages and infographics in the ConceptDraw PRO diagramming and vector drawing software extended with the Target and Circular Diagrams solution from the Marketing area of ConceptDraw Solution Park.
www.conceptdraw.com/ solution-park/ marketing-target-and-circular-diagrams
Circular arrow diagram 1
Circular arrow diagram 2
Arrow ring chart
Doughnut chart
Diamond pie chart
Pie chart
Circle diagram
Circle pie chart 2
Circle pie chart 1
Ring chart 1 - 3 elements
Ring chart 1 - 4 elements
Ring chart 1 - 5 elements
Ring chart 1 - 6 elements
Ring chart 1 - 7 elements
Ring chart 2 - 3 elements
Ring chart 2 - 4 elements
Ring chart 2 - 5 elements
Ring chart 2 - 6 elements
Ring chart 2 - 7 elements
Crystal diagram - 3 elements
Crystal diagram - 4 elements
Crystal diagram - 5 elements
Crystal diagram - 6 elements
Crystal diagram - 7 elements
Stacked Venn diagram - 4
Stacked Venn diagram - 5
Stacked Venn diagram - 6
Stacked Venn diagram - 7
Basic loop diagram
Block loop diagram
Arrow loop circle
Arrow loop - 3 circles
Arrow loop - 4 circles
Arrow loop - 5 circles
Arrow loop - 6 circles
Arrow loop - 7 circles
Arrow circle diagram - 3
Arrow circle diagram - 4
Stacked Venn diagram - 3
Arrow circle diagram - 5
Arrow circle diagram - 6
Arrow circle diagram - 7
Basic Flowchart Symbols and Meaning


This arrow loop diagram sample was created on the base of the figure illustrating the webpage "Safe Roads for a Safer Future A Joint Safety Strategic Plan" from the website of US Department of Transportation - Federal Highway Administration (FHWA) Office of Safety.
"STRATEGIC PLANNING CYCLE.
After the safety units issue the SSP, they will identify and prioritize strategies to support the established goals. Many strategies will originate in existing roadmaps or in other program planning activities. The safety units will also use this information when developing their Unit Performance Plans and individual performance plans. Teams within each safety unit will carry out projects and activities to support identified strategies and achieve the SSP goals.
The SSP process also includes continuous performance monitoring and evaluation through which the safety units will review past accomplishments against the established goals, consider how well strategies are implemented, assess progress toward goals, identify risks, consider changes in the environment, and discuss future strategic direction. As a part of the evaluation process, the three safety units will recognize achievements and discuss the need for adjustments. Figure ... shows the strategic planning cycle.
The safety units will update the SSP every 3 to 5 years using input from a variety of sources, including evaluations, safety trends, and legislative changes." [safety.fhwa.dot.gov/ ssp/ ]
The arrow loop diagram example "Strategic planning cycle" was created using the ConceptDraw PRO diagramming and vector drawing software extended with the Target and Circular Diagrams solution from the Marketing area of ConceptDraw Solution Park.
www.conceptdraw.com/ solution-park/ marketing-target-and-circular-diagrams
Arrow loop diagram
 Circular Arrows Diagrams
Circular Arrows Diagrams solution extends ConceptDraw PRO v10 with extensive drawing tools, predesigned samples, Circular flow diagram template for quick start, and a library of ready circular arrow vector stencils for drawing Circular Arrow Diagrams, Segmented Cycle Diagrams, and Circular Flow Diagrams. The elements in this solution help managers, analysts, business advisers, marketing experts, scientists, lecturers, and other knowledge workers in their daily work.
Swim Lane Flowchart Symbols

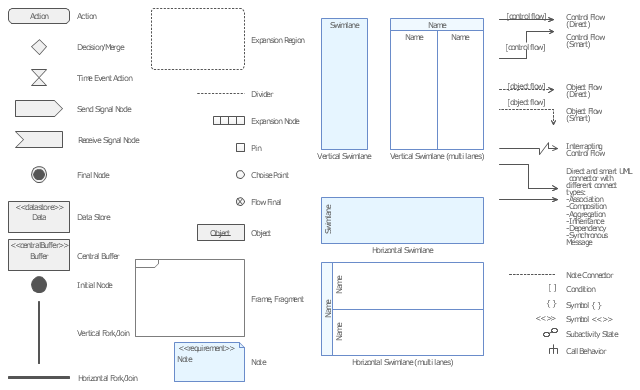
The vector stencils library "UML activity diagrams" contains 37 symbols for the ConceptDraw PRO diagramming and vector drawing software.
"Activity diagrams are constructed from a limited number of shapes, connected with arrows. The most important shape types:
(1) rounded rectangles represent actions;
(2) diamonds represent decisions;
(3) bars represent the start (split) or end (join) of concurrent activities;
(4) a black circle represents the start (initial state) of the workflow;
(5) an encircled black circle represents the end (final state).
Arrows run from the start towards the end and represent the order in which activities happen.
Hence they can be regarded as a form of flowchart. Typical flowchart techniques lack constructs for expressing concurrency. However, the join and split symbols in activity diagrams only resolve this for simple cases; the meaning of the model is not clear when they are arbitrarily combined with decisions or loops." [Activity diagram. Wikipedia]
The example "Design elements - UML activity diagrams" is included in the Rapid UML solution from the Software Development area of ConceptDraw Solution Park.
UML activity diagram symbols
Flowchart

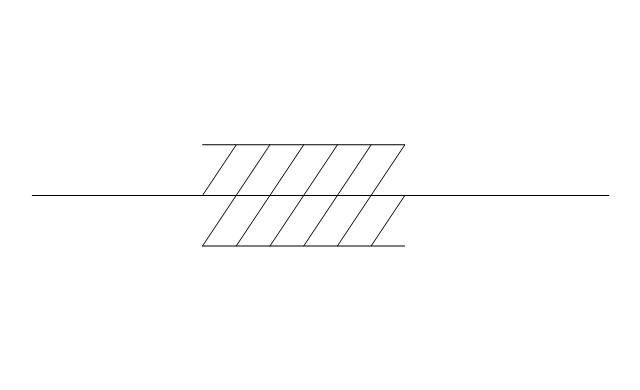
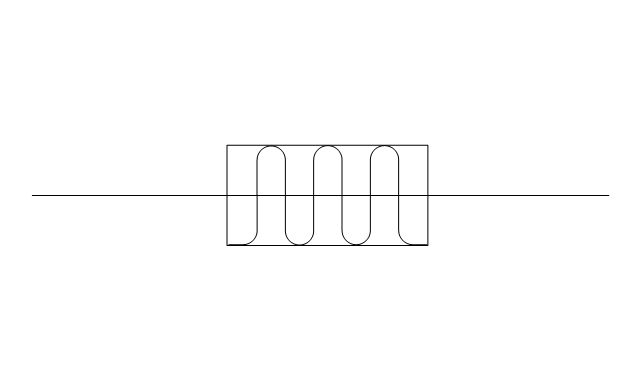
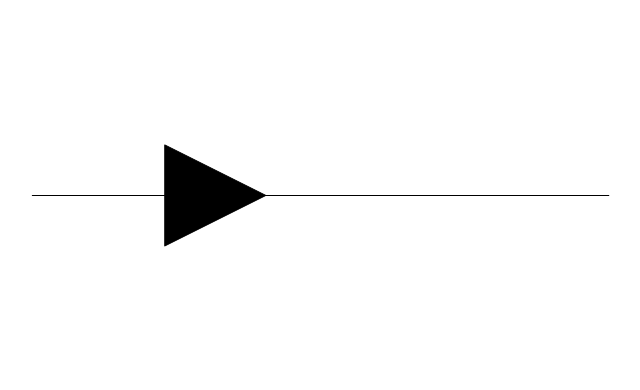
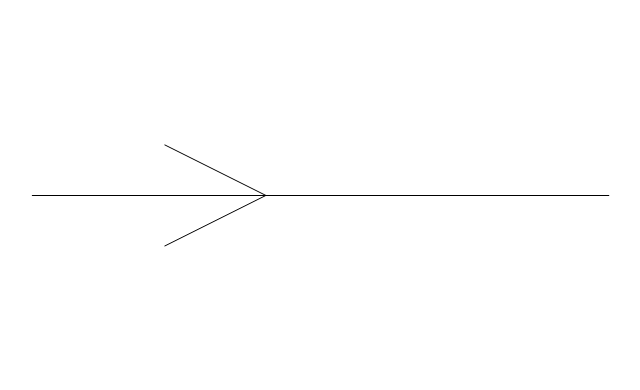
The vector stencils library "Pipes 2" contains 48 symbols of pipes. Use it for drawing plumbing and piping building plans, schematic diagrams, blueprints, or technical drawings of waste water disposal systems, hot and cold water supply systems in the ConceptDraw PRO diagramming and vector drawing software extended with the Plumbing and Piping Plans solution from the Building Plans area of ConceptDraw Solution Park.
Crossing
Junction
Basic support
Guide 1
Guide 2
Guide 3
Stopper
Anchor
Support / anchor
Hunger
Cross
Double branch

Jacketed
Sleeved
Sleeve joint
Expansion sleeve joint
Lagged
Bellows
Flow indication
Flow indication 2
Reducer
Reducer,arrow
Pipe bore change
Flexibility provision
Sleeve extension
Flow restrictor
Elbow 45
Elbow 90
Heated or cooled
Pneumatic line
Signal line
Electric line
Hydraulic line
Capillary line
Internal connection
Route radiation
Mechanical linkage
Electrical device
Vibratory device
Weight device
Spray device
Rotary motion
Stirring / fan
Access points

Trap
Expansion loop
Flexible hose
Flexible hose, flanged
Flow Map

Examples of Flowcharts, Org Charts and More


Business Process Flowchart Symbols

 Event-driven Process Chain Diagrams
Event-driven Process Chain (EPC) Diagram is a type of flowchart widely used for modeling in business engineering and reengineering, business process improvement, and analysis. EPC method was developed within the Architecture of Integrated Information Systems (ARIS) framework.
Flow Chart Symbols

Workflow Flowchart Symbols

- Circular Arrow | Circular Flow Diagram Template | Circular Arrows ...
- 3 Arrow Diagrams
- Target and Circular Diagrams | How to Draw a Circular Arrows ...
- How to Draw a Circular Arrows Diagram Using ConceptDraw PRO ...
- 3 Cycle Arrows
- Circular Flow Diagram Template | Circular Arrows | Pyramid Charts ...
- Arrow circle chart - Template | How to Draw a Circular Arrows ...
- Innovation life cycle - Arrow loop diagram | Target and Circular ...
- Circular diagrams - Vector stencils library | 3 D Heptagon Cycle In ...
- Circular diagrams - Vector stencils library | Circular arrows diagrams ...
- Arrow circle chart - Template | DFD Library - Design elements ...
- Innovation life cycle - Arrow loop diagram | Systems development ...
- Innovation life cycle - Arrow loop diagram | Strategic planning cycle ...
- Innovation life cycle - Arrow loop diagram | Basic Flowchart Symbols ...
- Systems development life cycle | Innovation life cycle - Arrow loop ...
- Circular Arrows Diagrams | Circular diagrams - Vector stencils ...
- Venn Diagram Three Circles
- Basic Flowchart Symbols and Meaning | Circular Arrow | Strategic ...
- Circular Arrows | Circular diagrams - Vector stencils library | DFD ...
- Target and Circular Diagrams | Circular Arrows Diagrams | Circular ...