Create Organizational Chart

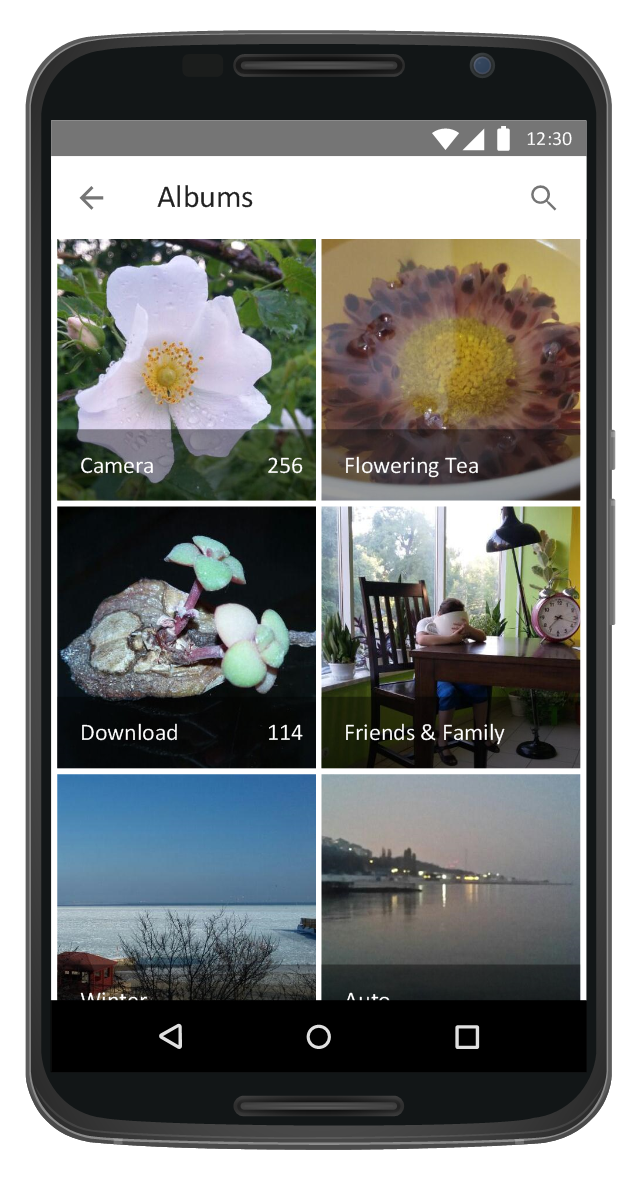
This Android 7 user interface example illustrates usage of Android Material Design single-line grid list.
"Grid lists are an alternative to standard list views.
A grid list consists of a repeated pattern of cells arrayed in a vertical and horizontal layout.
Grid lists are best used on similar data types. They help improve the visual comprehension of the content they contain. ...
A grid list is best suited to presenting homogenous data, typically images, and is optimized for visual comprehension and differentiating between similar data types. ...
A grid list consists of a repeated pattern of cells arrayed vertically and horizontally within the grid list.
Tiles hold content and can span one or more cells vertically or horizontally." [material.io/ guidelines/ components/ grid-lists.html]
The Android 7 UI design example "Single-line grid list" was created using the ConceptDraw PRO diagramming and vector drawing software extended with the "Android user interface" solution from the "Software Development" area of ConceptDraw Solution Park.
Single-line grid list
This line graph templates shows the number of tourists visiting the resort town for six months. Use it to design your time series line charts in ConceptDraw PRO diagramming and vector drawing software.
"A time series is a sequence of data points, measured typically at successive points in time spaced at uniform time intervals. ... Time series are very frequently plotted via line charts. Time series are used in statistics, signal processing, pattern recognition, econometrics, mathematical finance, weather forecasting, earthquake prediction, electroencephalography, control engineering, astronomy, and communications engineering. Time series analysis comprises methods for analyzing time series data in order to extract meaningful statistics and other characteristics of the data. Time series forecasting is the use of a model to predict future values based on previously observed values. While regression analysis is often employed in such a way as to test theories that the current values of one or more independent time series affect the current value of another time series, this type of analysis of time series is not called "time series analysis", which focuses on comparing values of time series at different points in time. Time series data have a natural temporal ordering." [Time series. Wikipedia]
The chart template "Line graph" is included in the Basic Line Graphs solution from the Graphs and Charts area of ConceptDraw Solution Park.
Chart template
Scrum process work items and workflow

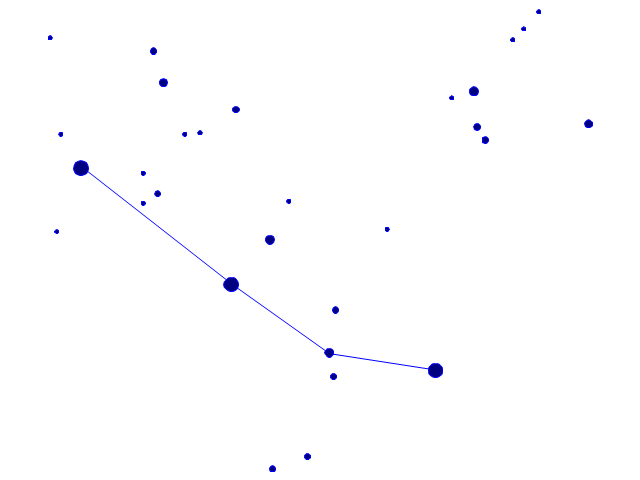
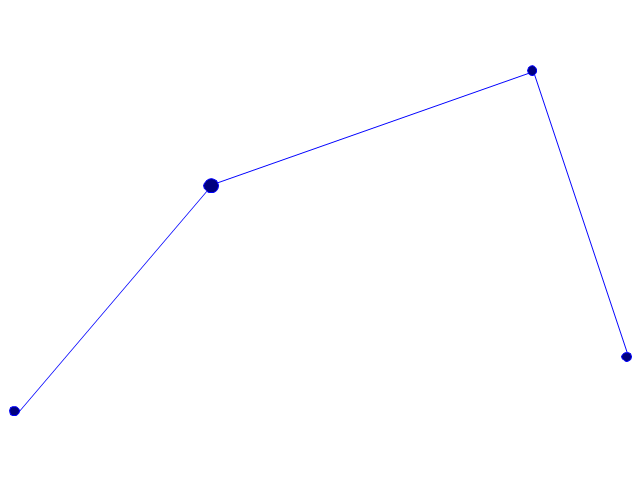
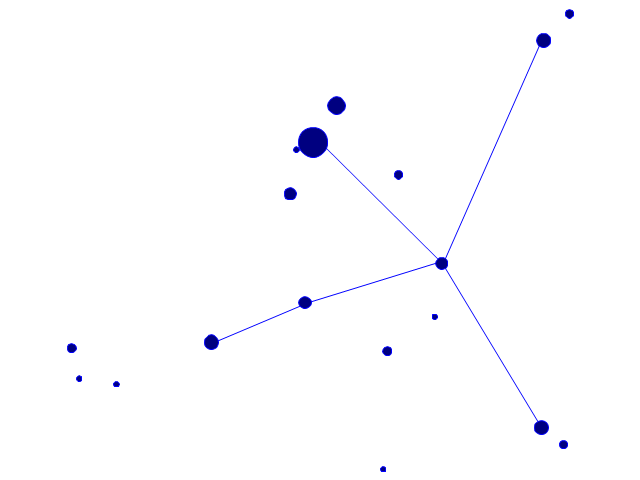
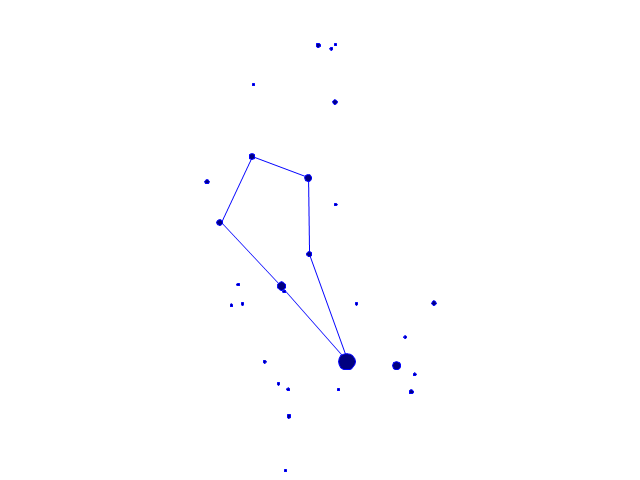
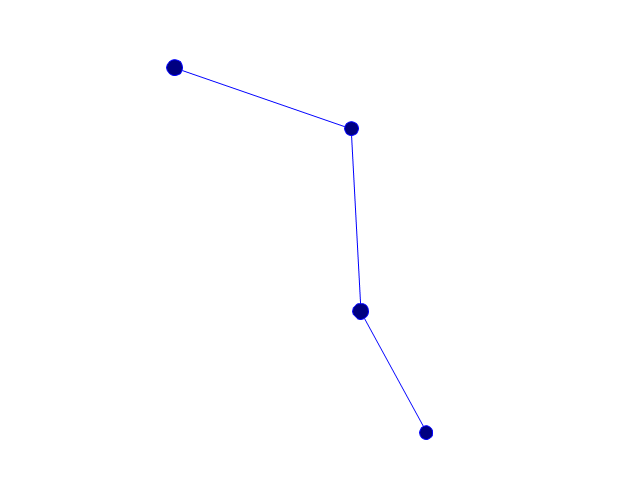
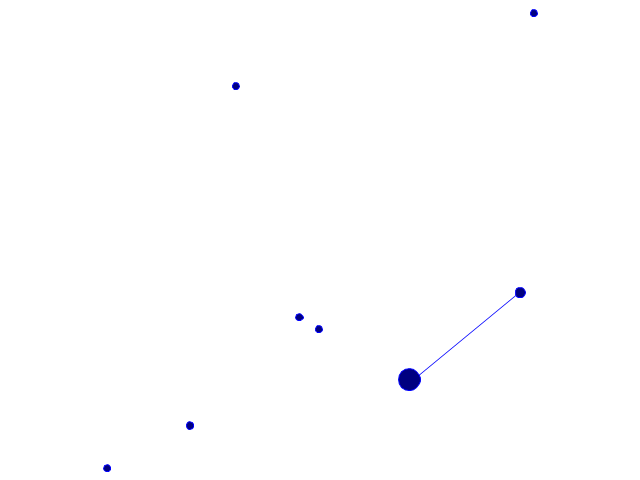
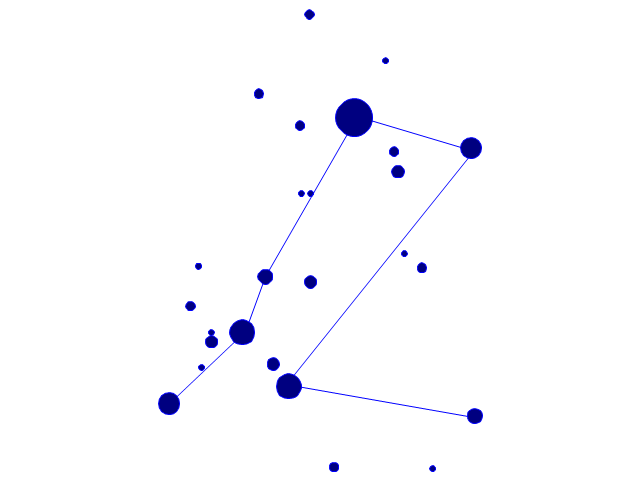
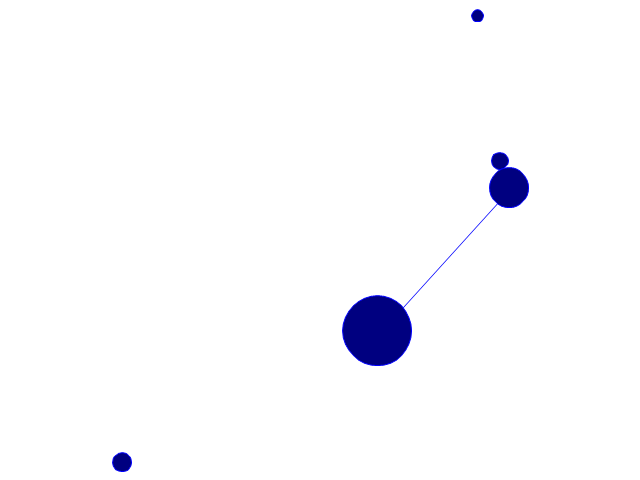
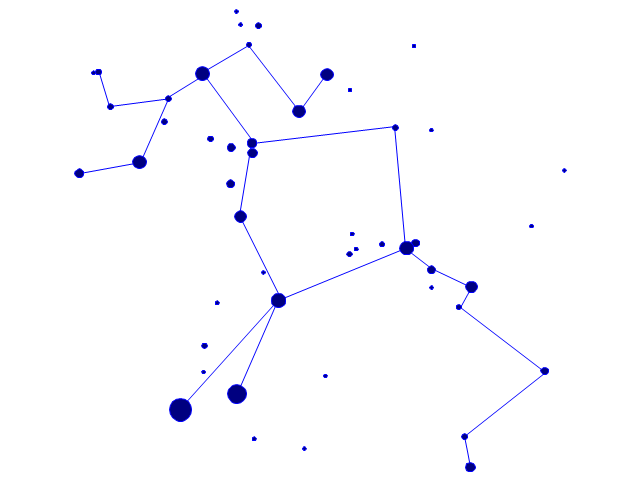
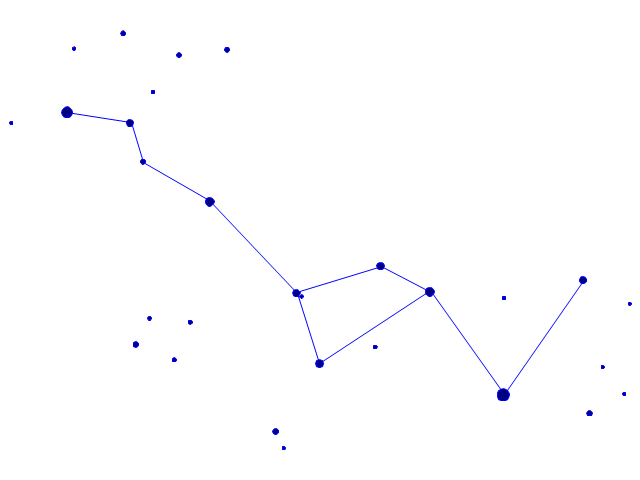
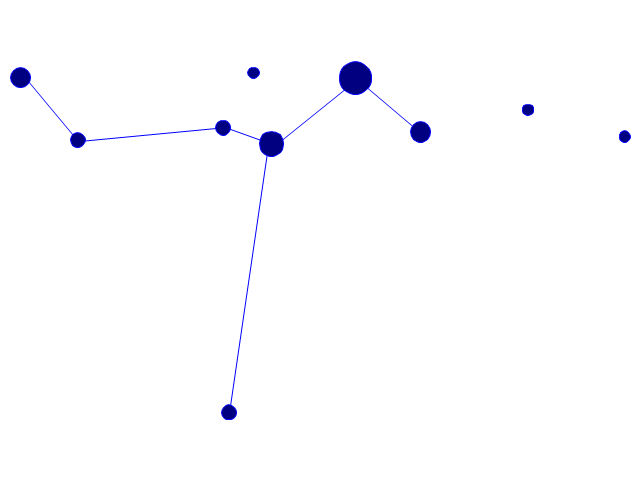
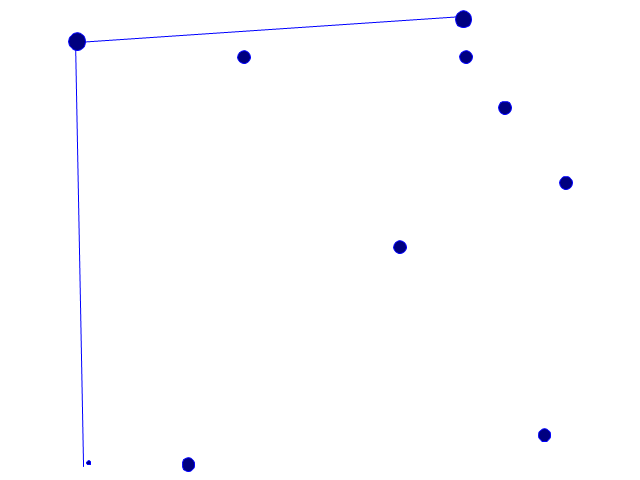
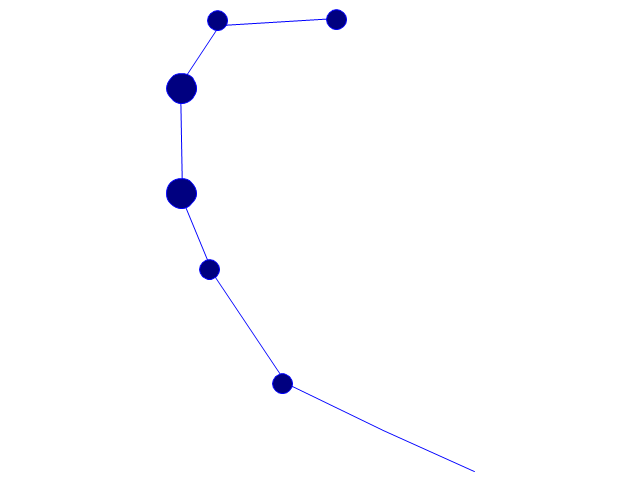
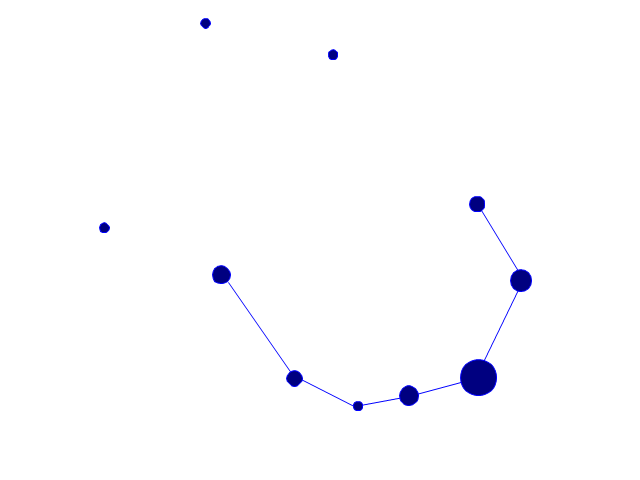
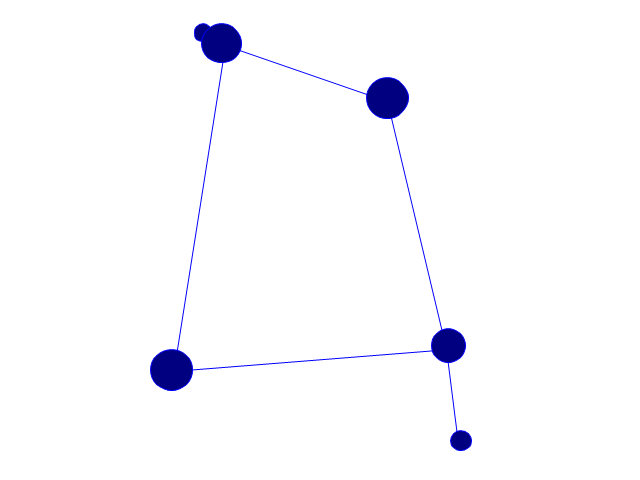
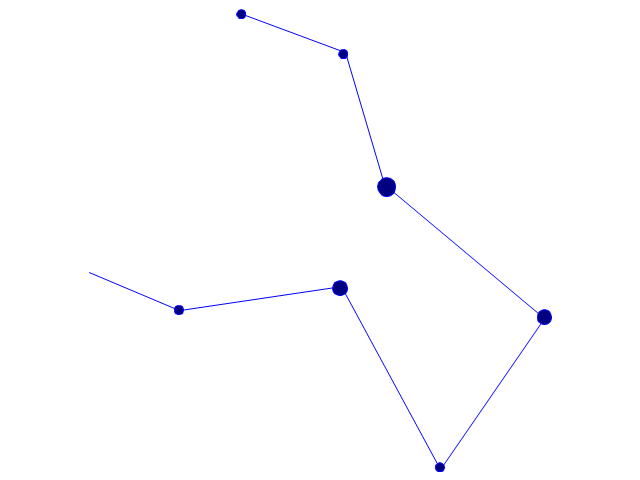
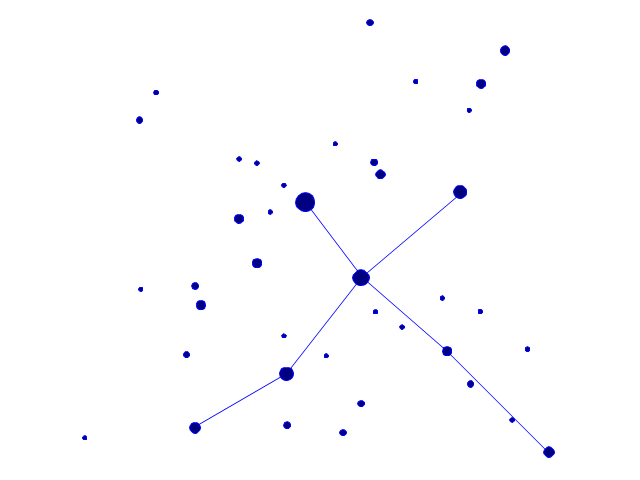
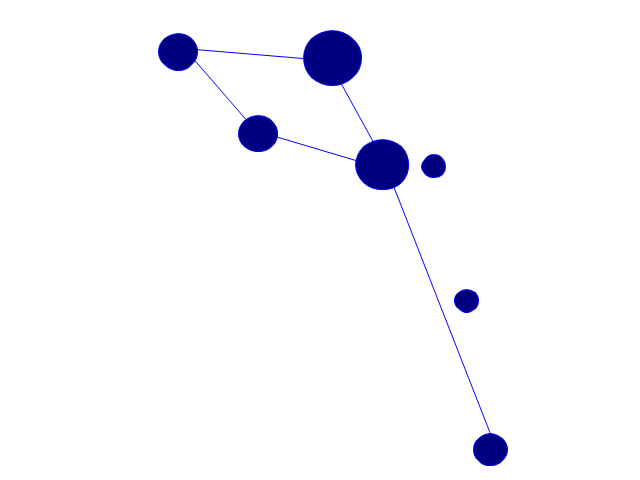
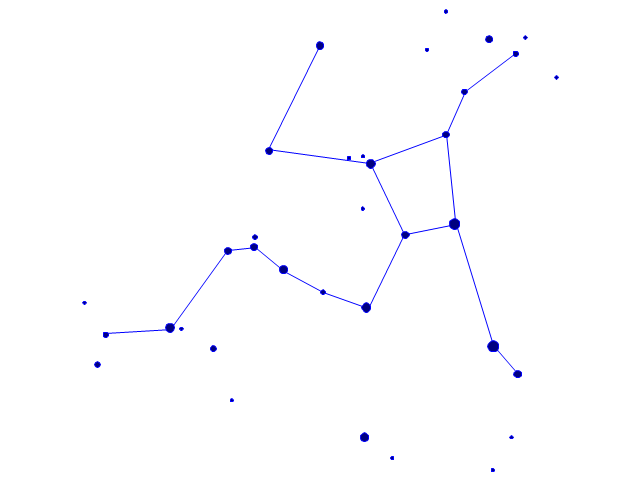
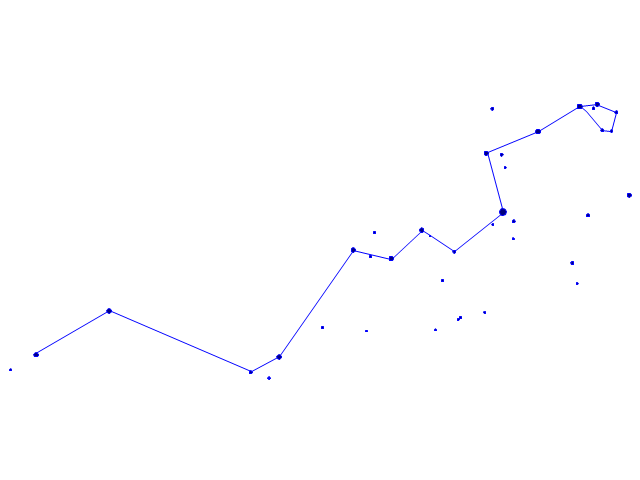
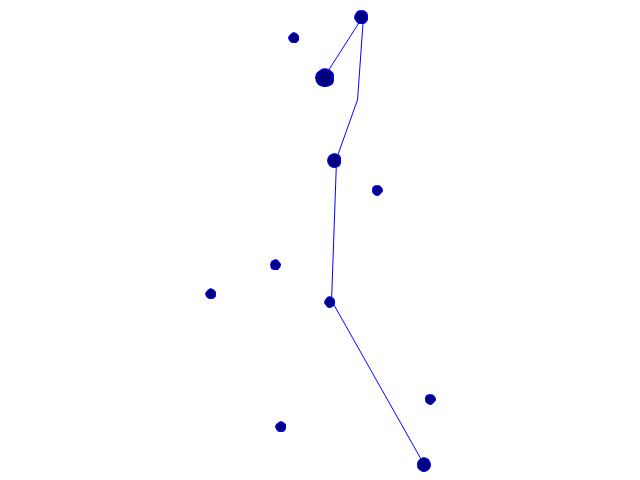
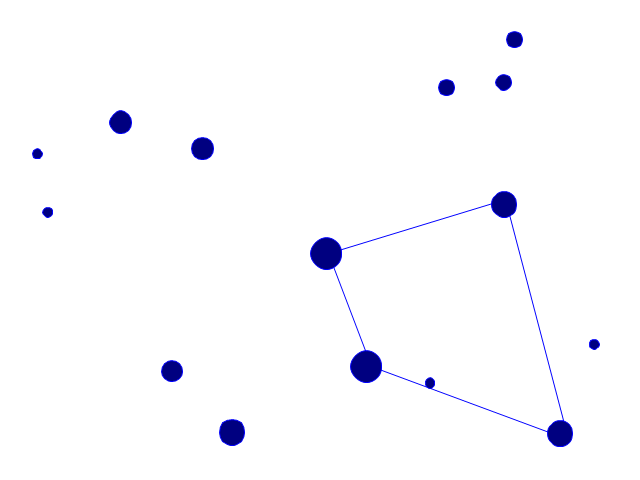
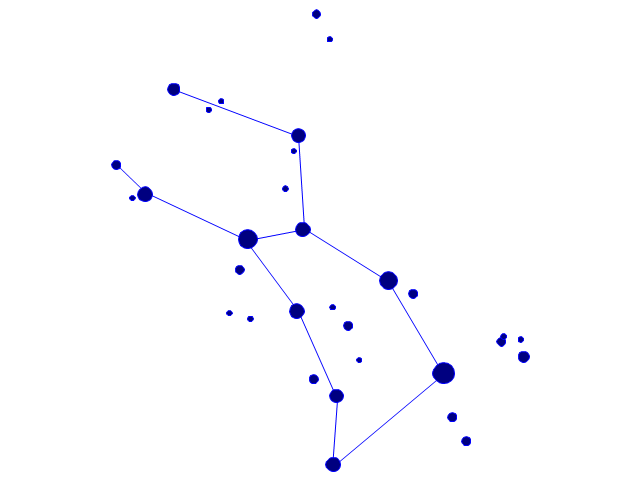
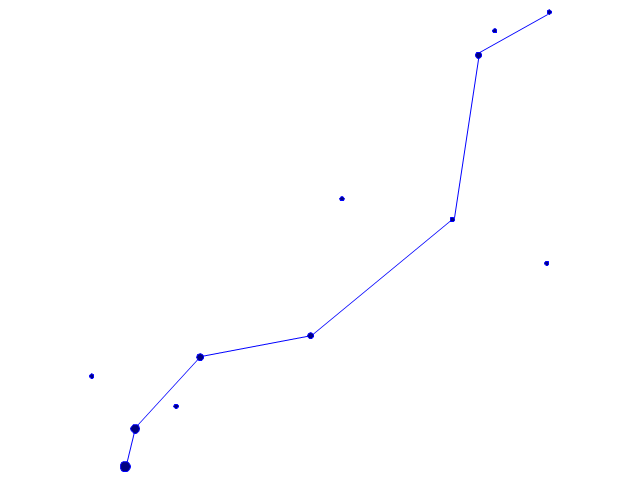
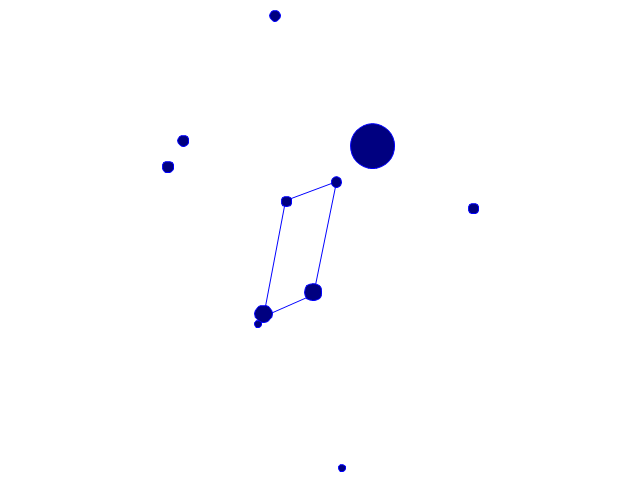
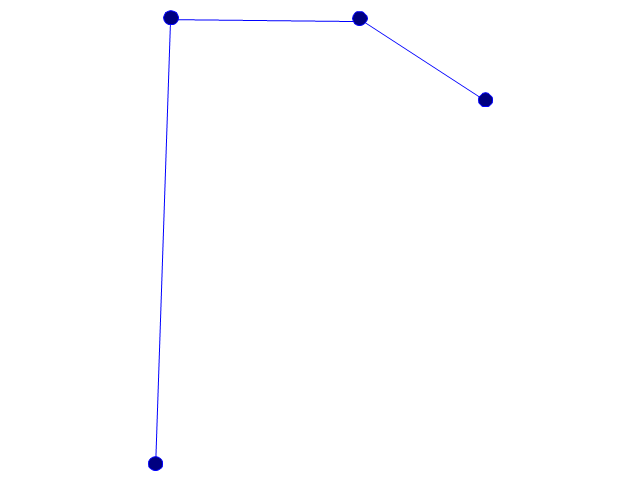
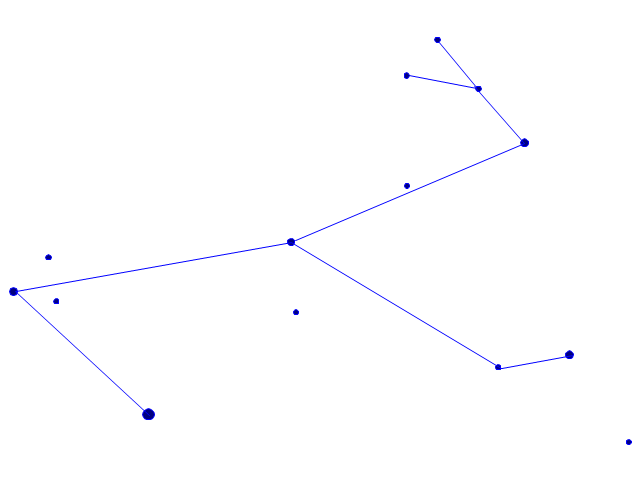
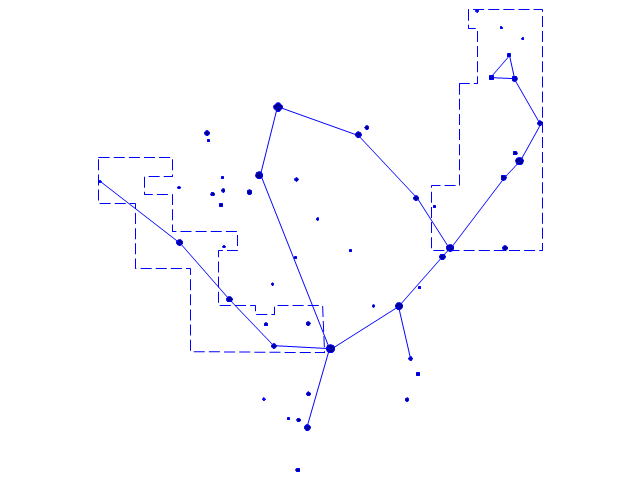
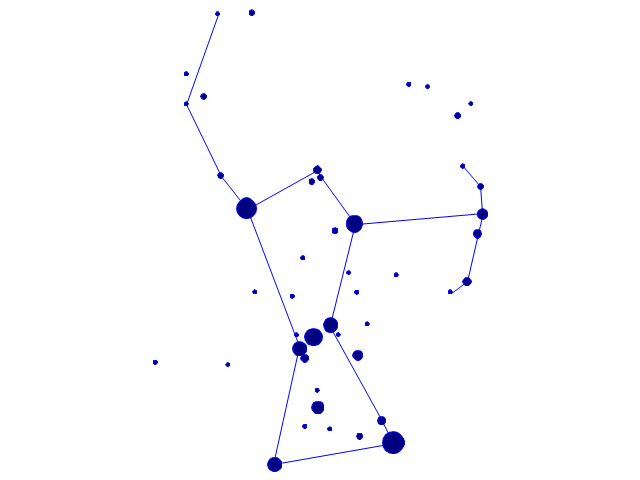
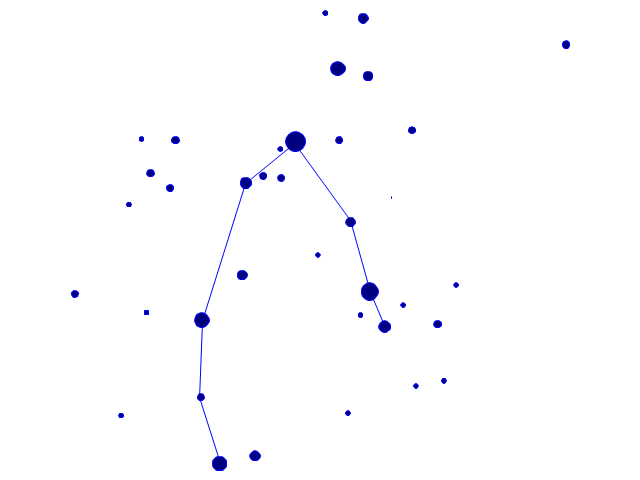
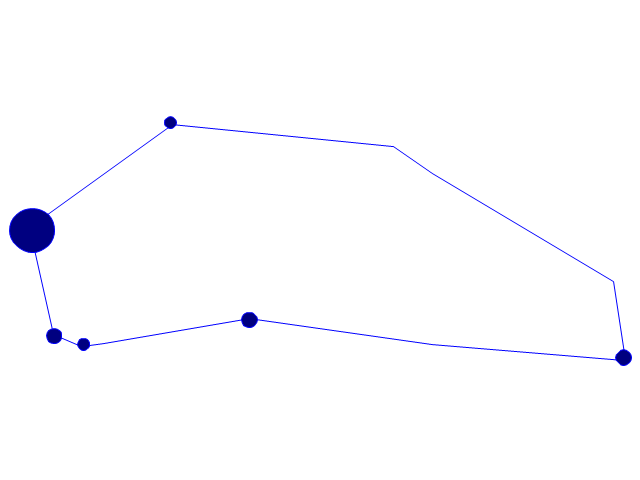
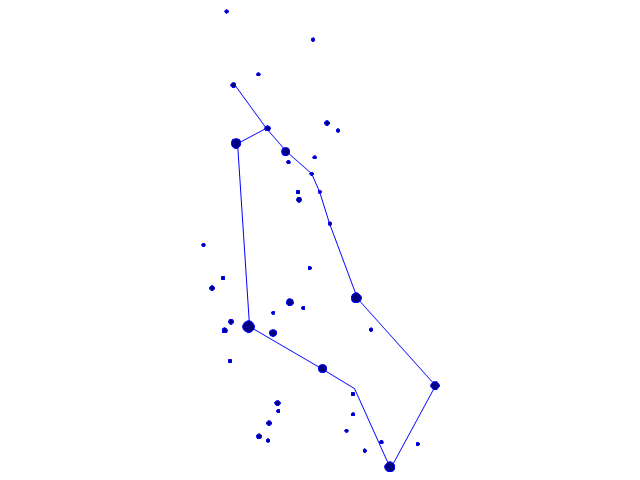
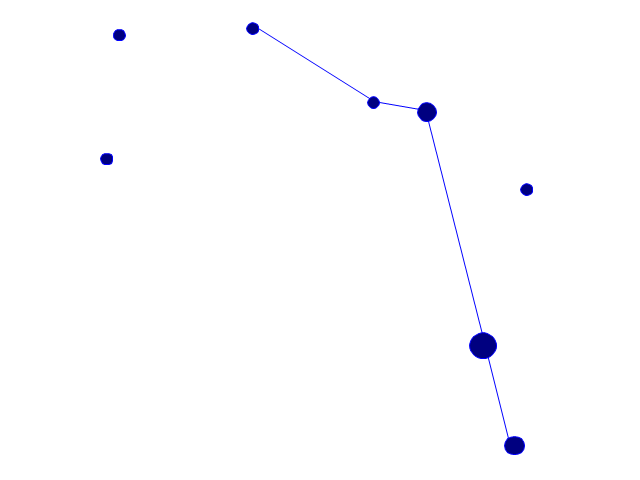
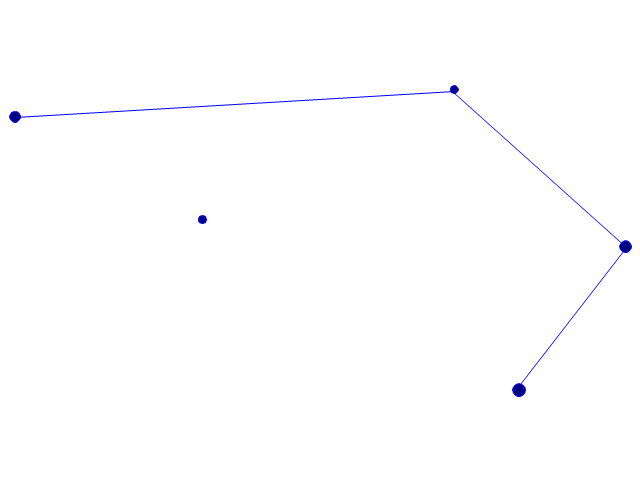
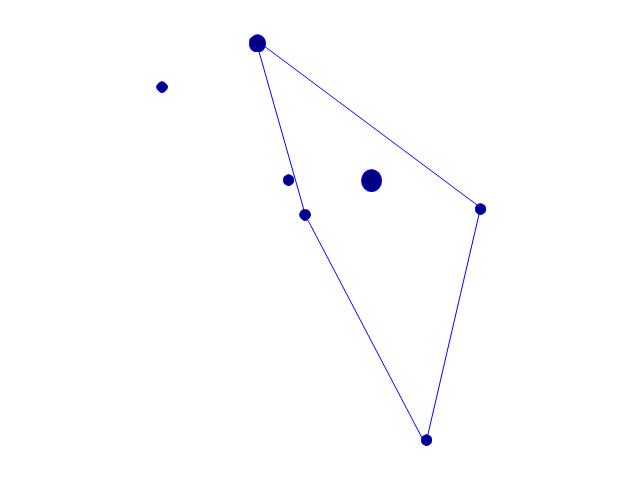
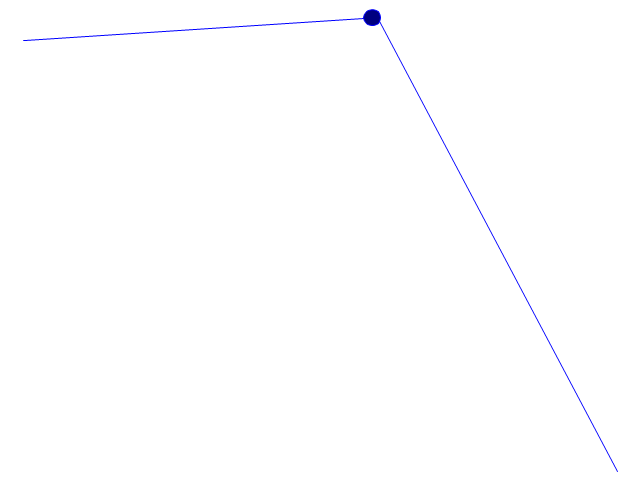
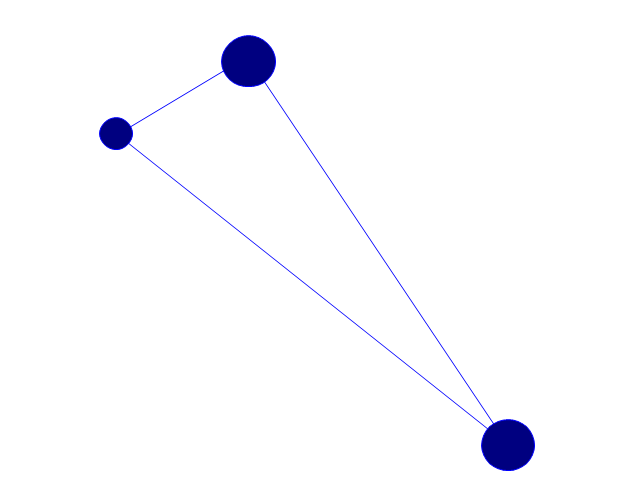
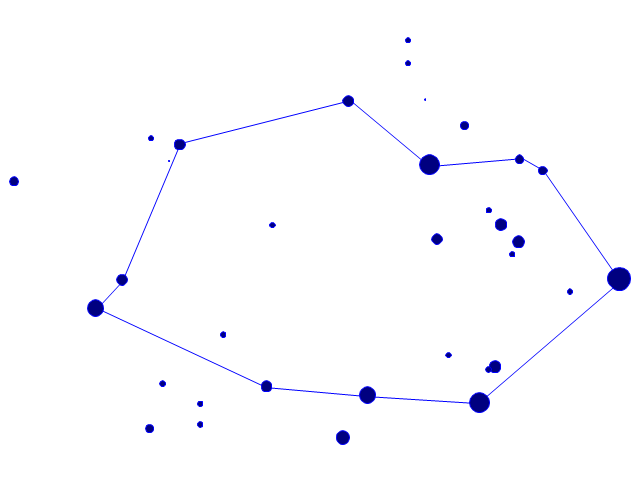
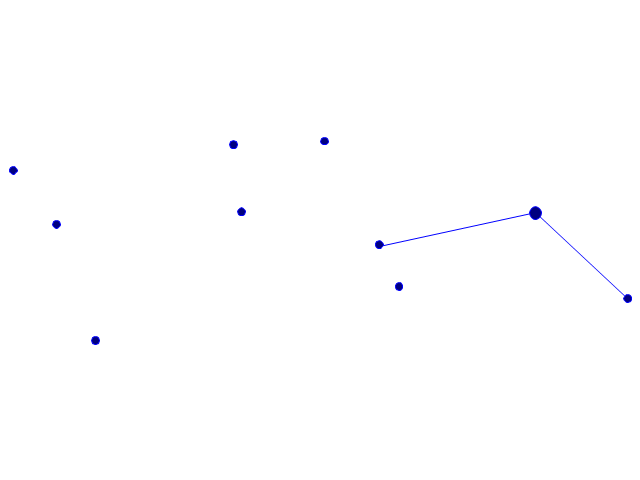
The vector stencils library "Constellations except Zodiac, Northern and Southern" contains 47 star constellation maps of all constellations except Zodiac, Northern (45-90 degrees) and Southern (45-90 degrees).
Use these shapes for drawing astronomical diagrams and illustrations in ConceptDraw PRO diagramming and vector drawing software extended with the Astronomy solution from the Science and Education area in ConceptDraw Solution Park.
Use these shapes for drawing astronomical diagrams and illustrations in ConceptDraw PRO diagramming and vector drawing software extended with the Astronomy solution from the Science and Education area in ConceptDraw Solution Park.
Andromeda
Antlia
Aquila
Auriga

Bootes
Caelum
Canes Venatici
Canis Major
Canis Minor
Centaurus
Cetus
Columba
Coma Berenices
Corona Australis
Corona Borealis
Corvus
Crater
Cygnus
Delphinus
Equuleus
Eridanus
Fornax
Grus
Hercules
Hydra
Lacerta
Leo Minor

Lepus
Lupus
Lynx
Lyra
Microscopium
Monoceros
Ophiuchus and Serpens
Orion
Pegasus

Perseus
Piscis Austrinus
Puppis
Pyxis
Sagitta
Sculptor
Scutum
Sextans
Triangulum
Vela
Vulpecula
Basic Flowchart Symbols and Meaning


Basketball Court Dimensions

 Line Graphs
How to draw a Line Graph with ease? The Line Graphs solution extends the capabilities of ConceptDraw PRO v10 with professionally designed templates, samples, and a library of vector stencils for drawing perfect Line Graphs.
How to draw Metro Map style infographics? Moscow, New York, Los Angeles, London

 Basic Line Graphs
This solution extends the capabilities of ConceptDraw PRO v10.3.0 (or later) with templates, samples and a library of vector stencils for drawing Line Graphs.
HelpDesk
How to Draw a Line Chart Quickly

How to Create a Line Chart

UML Class Diagram Generalization Example UML Diagrams

"A chart can take a large variety of forms, however there are common features that provide the chart with its ability to extract meaning from data.
Typically the data in a chart is represented graphically, since humans are generally able to infer meaning from pictures quicker than from text. Text is generally used only to annotate the data.
One of the more important uses of text in a graph is the title. A graph's title usually appears above the main graphic and provides a succinct description of what the data in the graph refers to.
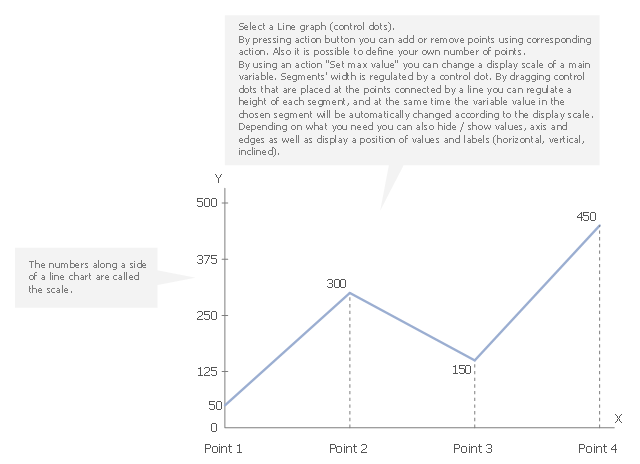
Dimensions in the data are often displayed on axes. If a horizontal and a vertical axis are used, they are usually referred to as the x-axis and y-axis respectively. Each axis will have a scale, denoted by periodic graduations and usually accompanied by numerical or categorical indications. Each axis will typically also have a label displayed outside or beside it, briefly describing the dimension represented. If the scale is numerical, the label will often be suffixed with the unit of that scale in parentheses. ...
Within the graph a grid of lines may appear to aid in the visual alignment of data. The grid can be enhanced by visually emphasizing the lines at regular or significant graduations. The emphasized lines are then called major grid lines and the remainder are minor grid lines.
The data of a chart can appear in all manner of formats, and may include individual textual labels describing the datum associated with the indicated position in the chart. The data may appear as dots or shapes, connected or unconnected, and in any combination of colors and patterns. Inferences or points of interest can be overlaid directly on the graph to further aid information extraction.
When the data appearing in a chart contains multiple variables, the chart may include a legend (also known as a key). A legend contains a list of the variables appearing in the chart and an example of their appearance. This information allows the data from each variable to be identified in the chart." [Chart. Wikipedia]
The vector stencils library "Time series charts" contains 10 templates: 3 column charts, 3 bar charts, 2 line graphs and 2 dot plots. All these charts are Live Objects displaying the data from external data source files.
Use these chart templates to design your business performance digital dashboards using the ConceptDraw PRO diagramming and vector drawing software.
The example "Design elements - Time series charts" is included in the Time Series Dashboard solution from the area "What is a Dashboard" of ConceptDraw Solution Park.
Typically the data in a chart is represented graphically, since humans are generally able to infer meaning from pictures quicker than from text. Text is generally used only to annotate the data.
One of the more important uses of text in a graph is the title. A graph's title usually appears above the main graphic and provides a succinct description of what the data in the graph refers to.
Dimensions in the data are often displayed on axes. If a horizontal and a vertical axis are used, they are usually referred to as the x-axis and y-axis respectively. Each axis will have a scale, denoted by periodic graduations and usually accompanied by numerical or categorical indications. Each axis will typically also have a label displayed outside or beside it, briefly describing the dimension represented. If the scale is numerical, the label will often be suffixed with the unit of that scale in parentheses. ...
Within the graph a grid of lines may appear to aid in the visual alignment of data. The grid can be enhanced by visually emphasizing the lines at regular or significant graduations. The emphasized lines are then called major grid lines and the remainder are minor grid lines.
The data of a chart can appear in all manner of formats, and may include individual textual labels describing the datum associated with the indicated position in the chart. The data may appear as dots or shapes, connected or unconnected, and in any combination of colors and patterns. Inferences or points of interest can be overlaid directly on the graph to further aid information extraction.
When the data appearing in a chart contains multiple variables, the chart may include a legend (also known as a key). A legend contains a list of the variables appearing in the chart and an example of their appearance. This information allows the data from each variable to be identified in the chart." [Chart. Wikipedia]
The vector stencils library "Time series charts" contains 10 templates: 3 column charts, 3 bar charts, 2 line graphs and 2 dot plots. All these charts are Live Objects displaying the data from external data source files.
Use these chart templates to design your business performance digital dashboards using the ConceptDraw PRO diagramming and vector drawing software.
The example "Design elements - Time series charts" is included in the Time Series Dashboard solution from the area "What is a Dashboard" of ConceptDraw Solution Park.
Time series charts

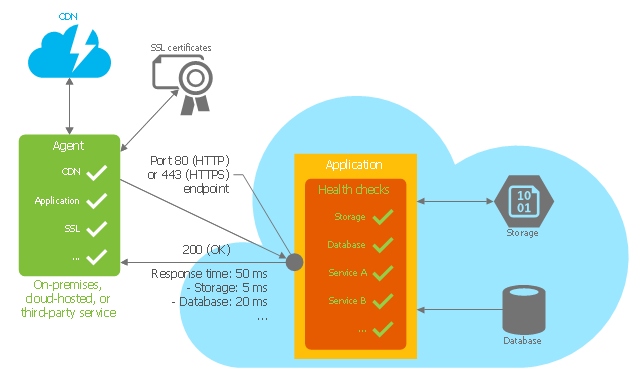
This Azure cloud architecture pattern diagram template was created on the base of figure in the article "Health Endpoint Monitoring Pattern" from the Microsoft Developer Network (MSDN) website.
"Health Endpoint Monitoring Pattern.
Implement functional checks within an application that external tools can access through exposed endpoints at regular intervals. This pattern can help to verify that applications and services are performing correctly. ...
It is good practice—and often a business requirement—to monitor web applications, and middle-tier and shared services, to ensure that they are available and performing correctly. However, it is more difficult to monitor services running in the cloud than it is to monitor on-premises services. ...
Implement health monitoring by sending requests to an endpoint on the application. The application should perform the necessary checks, and return an indication of its status.
A health monitoring check typically combines two factors: the checks (if any) performed by the application or service in response to the request to the health verification endpoint, and analysis of the result by the tool or framework that is performing the health verification check. The response code indicates the status of the application and, optionally, any components or services it uses. The latency or response time check is performed by the monitoring tool or framework." [msdn.microsoft.com/ ru-RU/ library/ dn589789.aspx]
The Azure cloud system architecture diagram template "Health endpoint monitoring pattern" for the ConceptDraw PRO diagramming and vector drawing software is included in the Azure Architecture solutin from the Computer and Networks area of ConceptDraw Solution Park.
Cloud computing system architecture diagram template
- Line Pattern Png
- Design elements - Time series charts | Line Chart Examples | Line ...
- Tourists Line Graph
- Line graph - Template
- Builder design pattern sequence | Chen's ERD of MMORPG ...
- Android 5.0 - Single- line list | Single- line grid list | Process Flowchart ...
- Line Graph Templates
- Single- line grid list | Android User Interface | Design elements ...
- Builder design pattern sequence | Professions - Vector stencils ...
- Single Line Drawing Software For Android
- Single Line Drawing Software Downloads For Android
- Line Chart Template for Word
- Time Series Dashboard | Design elements - Time series charts ...
- Line graph - Template | Bar chart - Template | Process Flowchart ...
- Scheduler agent supervisor pattern | Valet key pattern | Health ...
- Line Chart Template for Word | Scatter graph - Template | Double ...
- Tourism in the world: key figures | Valet key pattern | Basic Flowchart ...
- Line Chart Template for Word | Chart Maker for Presentations | Line ...
- Show Pattern For Draw Chart
- Network Glossary Definition | Raise Way Layout Pattern In Electricity