Chart Templates

Line Chart Template for Word

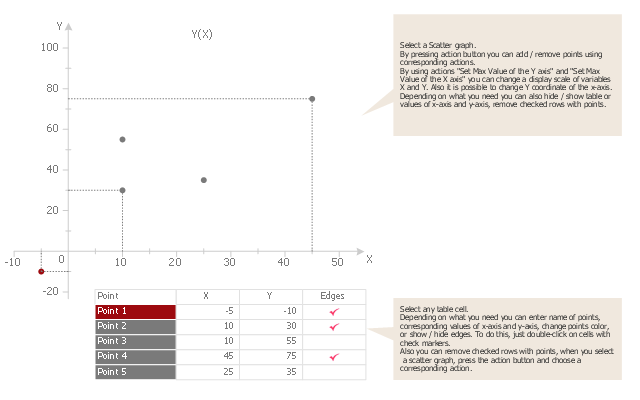
Use this template to design your scatter charts.
"A scatter plot, scatterplot, or scattergraph is a type of mathematical diagram using Cartesian coordinates to display values for two variables for a set of data.
The data is displayed as a collection of points, each having the value of one variable determining the position on the horizontal axis and the value of the other variable determining the position on the vertical axis. This kind of plot is also called a scatter chart, scattergram, scatter diagram, or scatter graph." [Scatter plot. Wikipedia]
The template "Scatter graph" for the ConceptDraw PRO diagramming and vector drawing software is included in the Scatter Diagrams solution from the Graphs and Charts area of ConceptDraw Solution Park.
Template
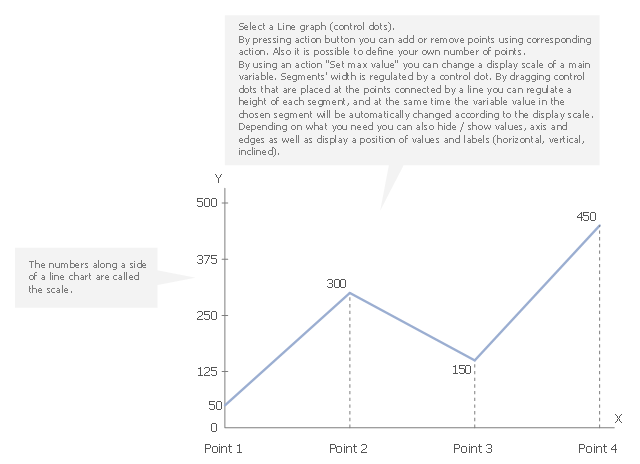
This line graph templates shows the number of tourists visiting the resort town for six months. Use it to design your time series line charts in ConceptDraw PRO diagramming and vector drawing software.
"A time series is a sequence of data points, measured typically at successive points in time spaced at uniform time intervals. ... Time series are very frequently plotted via line charts. Time series are used in statistics, signal processing, pattern recognition, econometrics, mathematical finance, weather forecasting, earthquake prediction, electroencephalography, control engineering, astronomy, and communications engineering. Time series analysis comprises methods for analyzing time series data in order to extract meaningful statistics and other characteristics of the data. Time series forecasting is the use of a model to predict future values based on previously observed values. While regression analysis is often employed in such a way as to test theories that the current values of one or more independent time series affect the current value of another time series, this type of analysis of time series is not called "time series analysis", which focuses on comparing values of time series at different points in time. Time series data have a natural temporal ordering." [Time series. Wikipedia]
The chart template "Line graph" is included in the Basic Line Graphs solution from the Graphs and Charts area of ConceptDraw Solution Park.
Chart template
Column Chart Template

Pie Chart Examples and Templates

Chart Maker for Presentations

Donut Chart Templates

Bar Chart Template for Word

Use this vertical bar chart template to design your column charts in the ConceptDraw PRO diagramming and vector drawing software.
"Bar graphs can ... be used for more complex comparisons of data with grouped bar charts and stacked bar charts. In a grouped bar chart, for each categorical group there are two or more bars. These bars are color-coded to represent a particular grouping. For example, a business owner with two stores might make a grouped bar chart with different colored bars to represent each store: the horizontal axis would show the months of the year and the vertical axis would show the revenue. Alternatively, a stacked bar chart could be used. The stacked bar chart stacks bars that represent different groups on top of each other. The height of the resulting bar shows the combined result of the groups. However, stacked bar charts are not suited to datasets where some groups have negative values. In such cases, grouped bar charts are preferable." [Bar chart. Wikipedia]
The column chart template "Double bar graph" is included in the Basic Bar Graphs solution from the Graphs and Charts area of ConceptDraw Solution Park.
Template

- Line graph - Template
- Bar Chart Template for Word | Column Chart Template | Chart Maker ...
- Area chart - Template | Design elements - Area charts | Area charts ...
- Line Chart Template for Word
- Bar Chart Template for Word | Double bar graph - Template | Bar ...
- Line Graph Templates
- Examples Of Line Graph Templates
- Bar Chart Template for Word | Waterfall Bar Chart | Column Chart ...
- Line Graph Templates Ppt
- Line Chart Examples | Line Chart Template for Word | How to Draw ...