 Line Graphs
How to draw a Line Graph with ease? The Line Graphs solution extends the capabilities of ConceptDraw PRO v10 with professionally designed templates, samples, and a library of vector stencils for drawing perfect Line Graphs.
HelpDesk
How to Draw a Line Chart Quickly

How to Create a Line Chart

Line Chart Examples

Line Chart Template for Word

Line Graph Charting Software

HelpDesk
How to Change the Form and Color of a Topic’s Line in Your Mind Map

HelpDesk
How to Show the Relationship Between Topics


Chart Maker for Presentations

HelpDesk
How to Set Line Jumps for Smart Connectors in ConceptDraw PRO

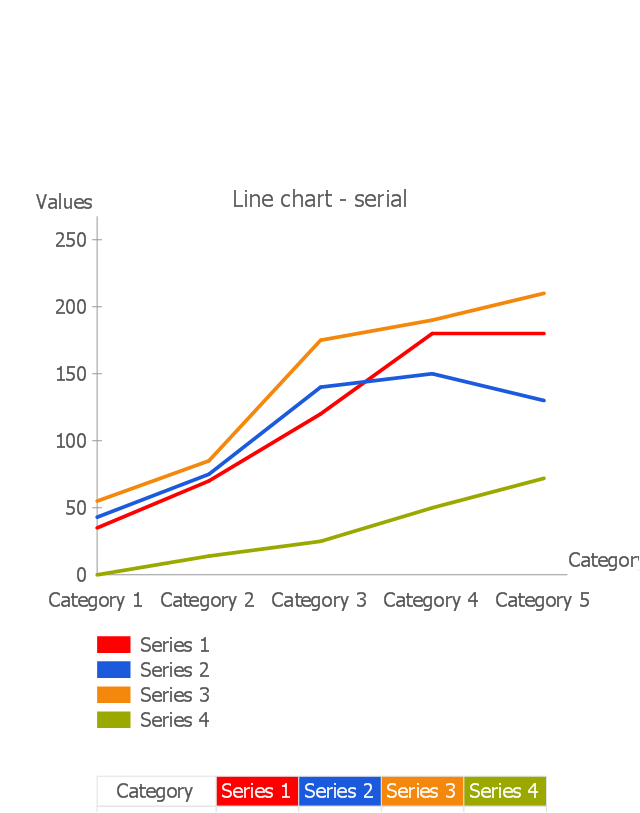
"A line chart or line graph is a type of chart which displays information as a series of data points connected by straight line segments. It is a basic type of chart common in many fields. It is similar to a scatter plot except that the measurement points are ordered (typically by their x-axis value) and joined with straight line segments. A line chart is often used to visualize a trend in data over intervals of time – a time series – thus the line is often drawn chronologically." [Line chart. Wikipedia]
The templates example "Design elements - Line graphs" was drawn using the ConceptDraw PRO diagramming and vector drawing software extended with the Line Graphs solution from the Graphs and Charts area of ConceptDraw Solution Park.
The templates example "Design elements - Line graphs" was drawn using the ConceptDraw PRO diagramming and vector drawing software extended with the Line Graphs solution from the Graphs and Charts area of ConceptDraw Solution Park.
Templates
This line chart sample depicts data from the European Economic Forecast (EUROPEAN ECONOMY 1|2013, Economic and Financial Affairs Winter 2013, European Commission).
[ec.europa.eu/ economy_ finance/ publications/ european_ economy/ 2013/ pdf/ ee1_ en.pdf]
"Exports in France decreased to 36526 EUR Million in October of 2013 from 36637 EUR Million in September of 2013. Exports in France is reported by the Ministère de l'Économie et des Finances. Exports in France averaged 17102.29 EUR Million from 1970 until 2013, reaching an all time high of 37964 EUR Million in August of 2012 and a record low of 1165.60 EUR Million in May of 1970. France is one of the largest exporters of luxury goods and agricultural products in the world. France main exports are: aircrafts (10.1 percent of total exports), food (9.7 percent), chemicals (9.5 percent), industrial machinery (8.3 percent), iron and steel (7.9 percent), electronics (6.7 percent), motor vehicles (6.3 percent) and pharmaceuticals (6.1 percent). Trade outflows to Europe account for 70 percent of total exports. Main export partners are: Germany (16.6 percent of total exports), Italy (8.2 percent), Spain (7.3 percent), Belgium (7.2 percent), the United Kingdom (6.6 percent), the United States (5.6 percent), Netherlands and China. This page contains - France Exports - actual values, historical data, forecast, chart, statistics, economic calendar and news." [tradingeconomics.com/ france/ exports]
The line graph example "France exports of goods and services" was created using ConceptDraw PRO diagramming and vector drawing software extended with Line Graphs solution from Graphs and Charts area of ConceptDraw Solution Park.
Line chart

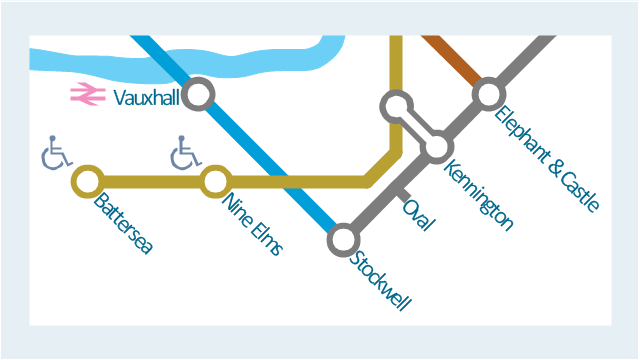
This spatial infographic example was created on the base of the tube map from the Transport for London website.
[tfl.gov.uk/ assets/ images/ general/ 24746-nle-gallery-tube-map.jpg]
"The Tube map is a schematic transit map of the lines and stations of London's public rapid transit railway systems, namely the London Underground (commonly known as the Tube, hence the name), Docklands Light Railway, London Overground and Emirates Air Line, as well as being incorporated into Greater London connections maps.
As a schematic diagram, it shows not necessarily the geographic but rather the relative positions of stations along the lines, stations' connective relations with each other and fare zones. The basic design concepts have been widely adopted for other network maps around the world, especially that of mapping topologically rather than geographically." [Tube map. Wikipedia]
The spatial infographics example "Metro map - Northern line extension to Battersea via Nine Elms" was created using the ConceptDraw PRO diagramming and vector drawing software extended with the Spatial Infographics solution from the area "What is Infographics" of ConceptDraw Solution Park.
Tube map
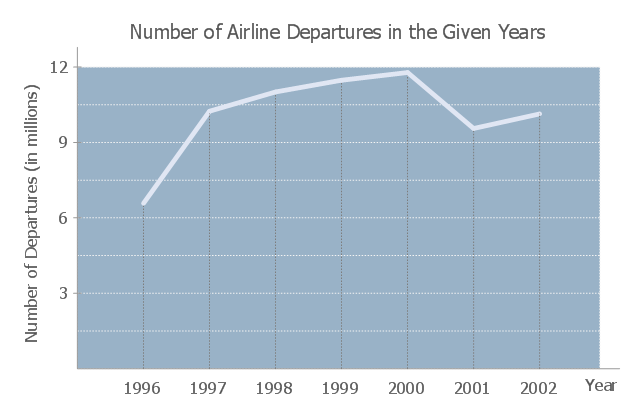
This line graph sample shows the number of airlines departures in 1996-2002. It was designed on the base of the Wikimedia Commons file: -6 time series.JPG
[commons.wikimedia.org/ wiki/ File:-6_ time_ series.JPG].
"The social science of economics makes extensive use graphs to better illustrate the economic principles and trends it is attempting to explain. Those graphs have specific qualities that are not often found (or are not often found in such combinations) in other sciences. ...
More generally, there is usually some mathematical model underlying any given economic graph. For instance, the commonly used supply-and-demand graph has its underpinnings in general price theory — a highly mathematical discipline." [Economic graph. Wikipedia]
The line chart example "Number of airlines departures in the given years" was designed using the ConceptDraw PRO diagramming and vector drawing software extended with the Line Graphs solution from the Graphs and Charts area of ConceptDraw Solution Park.
Line chart
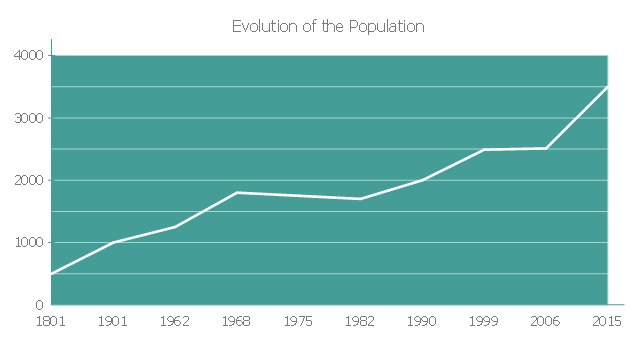
This line chart example showing evolution of the population from 1801 till nowadays was redesigned from the Wikimedia Commons file: Evolution de la population vertoise 1801 maintenant.JPG.
[commons.wikimedia.org/ wiki/ File:Evolution_ de_ la_ population_ vertoise_ 1801_ maintenant.JPG]
"Evolution is the change in the inherited characteristics of biological populations over successive generations. Evolutionary processes give rise to diversity at every level of biological organisation, including species, individual organisms and molecules such as DNA and proteins.
All life on Earth is descended from a last universal ancestor that lived approximately 3.8 billion years ago. Repeated speciation and the divergence of life can be inferred from shared sets of biochemical and morphological traits, or by shared DNA sequences. These homologous traits and sequences are more similar among species that share a more recent common ancestor, and can be used to reconstruct evolutionary histories, using both existing species and the fossil record. Existing patterns of biodiversity have been shaped both by speciation and by extinction." [Evolution. Wikipedia]
The line graph example "Evolution of the population" was created using the ConceptDraw PRO diagramming and vector drawing software extended with the Line Graphs solution from the Graphs and Charts area of ConceptDraw Solution Park.
Line chart
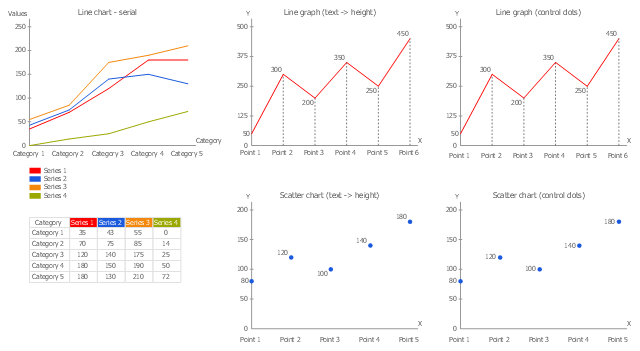
The vector stencils library "Line graphs" contains 5 templates of line graphs and scatter charts for visualizing data changes over time. Drag a template from the library to your document and enter your data.
Use these shapes to draw your line and scatter charts in the ConceptDraw PRO diagramming and vector drawing software.
The vector stencils library "Line graphs" is included in the Line Graphs solution from the Graphs and Charts area of ConceptDraw Solution Park.
Use these shapes to draw your line and scatter charts in the ConceptDraw PRO diagramming and vector drawing software.
The vector stencils library "Line graphs" is included in the Line Graphs solution from the Graphs and Charts area of ConceptDraw Solution Park.
Line graph (text -> height)
-line-graphs---vector-stencils-library.png--diagram-flowchart-example.png)
Line graph (control dots)
-line-graphs---vector-stencils-library.png--diagram-flowchart-example.png)
Scatter chart (text -> height)
-line-graphs---vector-stencils-library.png--diagram-flowchart-example.png)
Scatter chart (control dots)
-line-graphs---vector-stencils-library.png--diagram-flowchart-example.png)
Line chart - serial
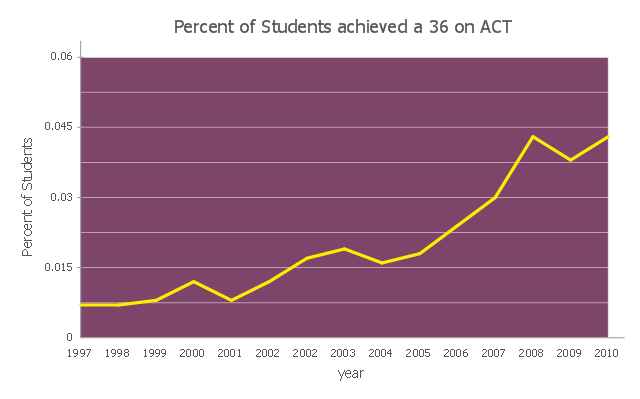
This line graph sample shows the percent of students achieved a 36 on ACT from 1997 to 2011. It was designed on the base of the Wikimedia Commons file: ACT-36-1997 to 2011.png.
[commons.wikimedia.org/ wiki/ File:ACT-36-1997_ to_ 2011.png]
This file is licensed under the Creative Commons Attribution-Share Alike 3.0 Unported license.
[creativecommons.org/ licenses/ by-sa/ 3.0/ deed.en]
"The ACT (... American College Testing) college readiness assessment is a standardized test for high school achievement and college admissions in the United States produced by ACT, Inc. It was first administered in November 1959 by Everett Franklin Lindquist as a competitor to the College Board's Scholastic Aptitude Test, now the SAT Reasoning Test. The ACT originally consisted of four tests: English, Mathematics, Social Studies, and Natural Sciences. In 1989, the Social Studies test was changed into a Reading section (which included a Social Studies subsection) and the Natural Sciences test was renamed the Science Reasoning test, with more emphasis on problem solving skills. In February 2005, an optional Writing test was added to the ACT... In the Spring of 2015, the ACT will start to be offered as a computer-based test that will incorporate some optional Constructed Response Questions; the test content, composite score and multiple choice format will not be affected by these changes. ...
All four-year colleges and universities in the U.S. accept the ACT, but different institutions place different emphases on standardized tests such as the ACT, compared to other factors of evaluation such as class rank, GPA, and extracurricular activities. The main four tests are scored individually on a scale of 1–36, and a Composite score is provided which is the whole number average of the four scores." [ACT (test). Wikipedia]
The line chart example "Percent of students achieved a 36 on ACT" was created using the ConceptDraw PRO diagramming and vector drawing software extended with the Line Graphs solution from the Graphs and Charts area of ConceptDraw Solution Park.
Line chart
The vector stencils library "Line graphs" contains 5 templates of line graphs and scatter charts for visualizing data changes over time. Drag a template from the library to your document and enter your data.
Use these shapes to draw your line and scatter charts in the ConceptDraw PRO diagramming and vector drawing software.
The vector stencils library "Line graphs" is included in the Line Graphs solution from the Graphs and Charts area of ConceptDraw Solution Park.
Use these shapes to draw your line and scatter charts in the ConceptDraw PRO diagramming and vector drawing software.
The vector stencils library "Line graphs" is included in the Line Graphs solution from the Graphs and Charts area of ConceptDraw Solution Park.
Line graph (text -> height)
Line graph (control dots)
Scatter chart (text -> height)
Scatter chart (control dots)
Line chart - serial
- Line Chart Examples | How to Create a Line Chart | Line chart ...
- Line graph template | Line Graph Charting Software | Line Graphs ...
- Line Chart Examples - Conceptdraw.com
- Line Graphs | Line Graph Charting Software | Line graph template ...
- Line Chart Examples | Line Graph Charting Software | Chart ...
- Line Graph Charting Software - Conceptdraw.com
- Timeline Diagrams | Line Chart Examples | Line Graph Charting ...
- Line Graph Charting Software | Basic Diagramming | How to Create ...
- Line Chart Templates
- Line chart - Evolution of the population | Line Chart Examples | Basic ...
- Line graph template - The number of tourists visiting the resort town ...
- Basic Diagramming | Line Chart Template for Word | Line Graph ...
- Line Graphs
- Line Graph Charting Software - Conceptdraw.com
- Line Chart Template for Word | How to Create a Line Chart | Line ...
- Create Graphs and Charts | Line Graph Charting Software ...
- Line Graph Charting Software
- Create Graphs and Charts | Basic Diagramming | Line Graph ...
- Line Graph Charting Software | Create Graphs and Charts | Chart ...
- The Best Drawing Program for Mac | Scatter Chart Examples | Line ...